The Strategies blog
Practical, no-hype trading education — fresh insights published every day. Skim a strategy, then go deeper in the book.
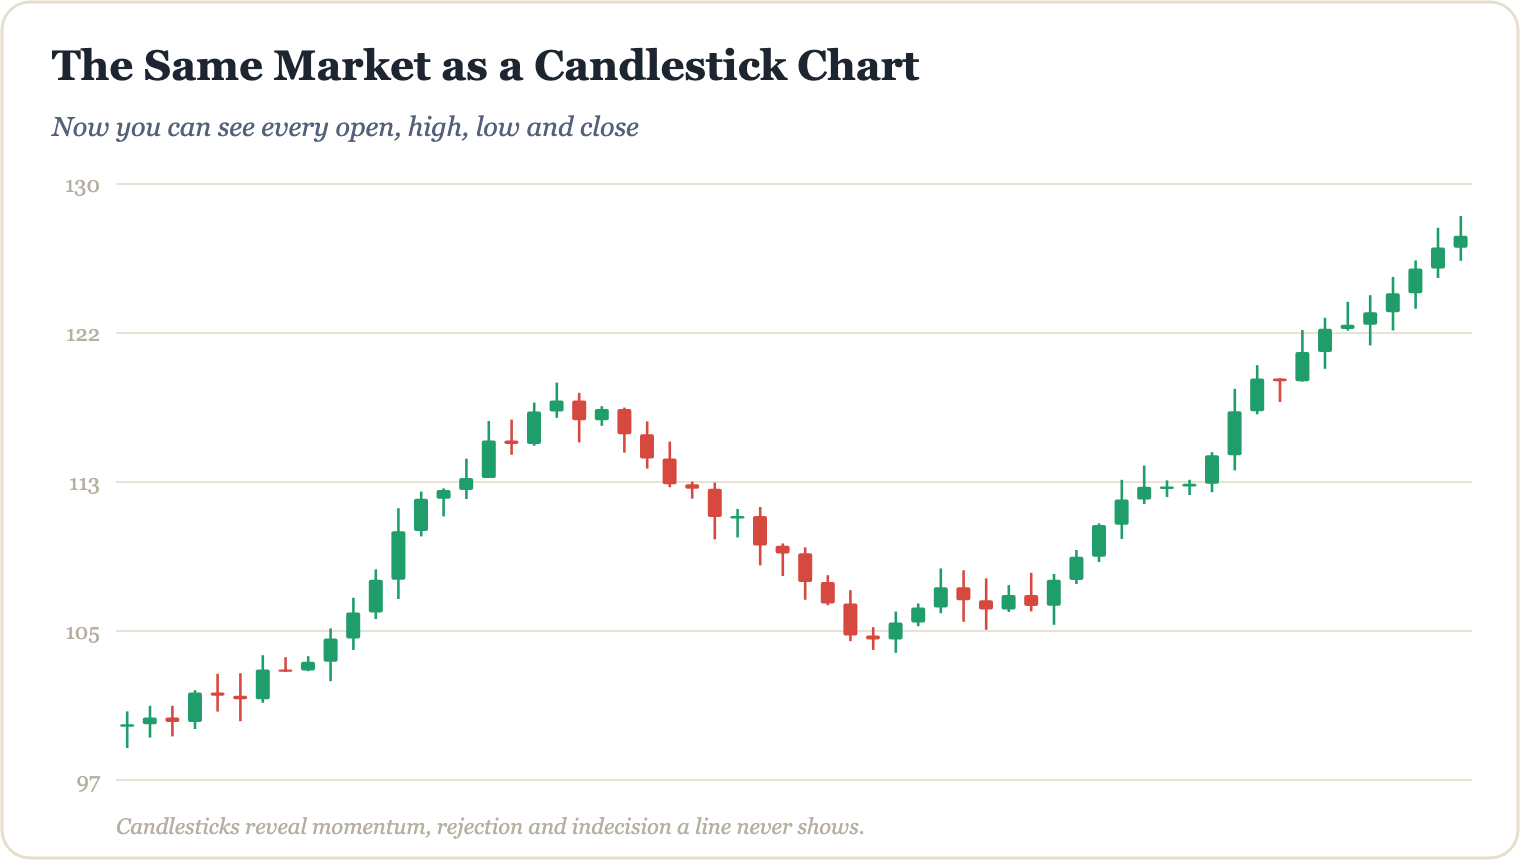
How to Read a Candlestick Chart in 30 Seconds
Candlestick charts look intimidating at first — but once you know what each part means, you can absorb a market's story at a glance. Here's how to do it in 30 seconds flat.
Jun 27, 2026 · 5 min read
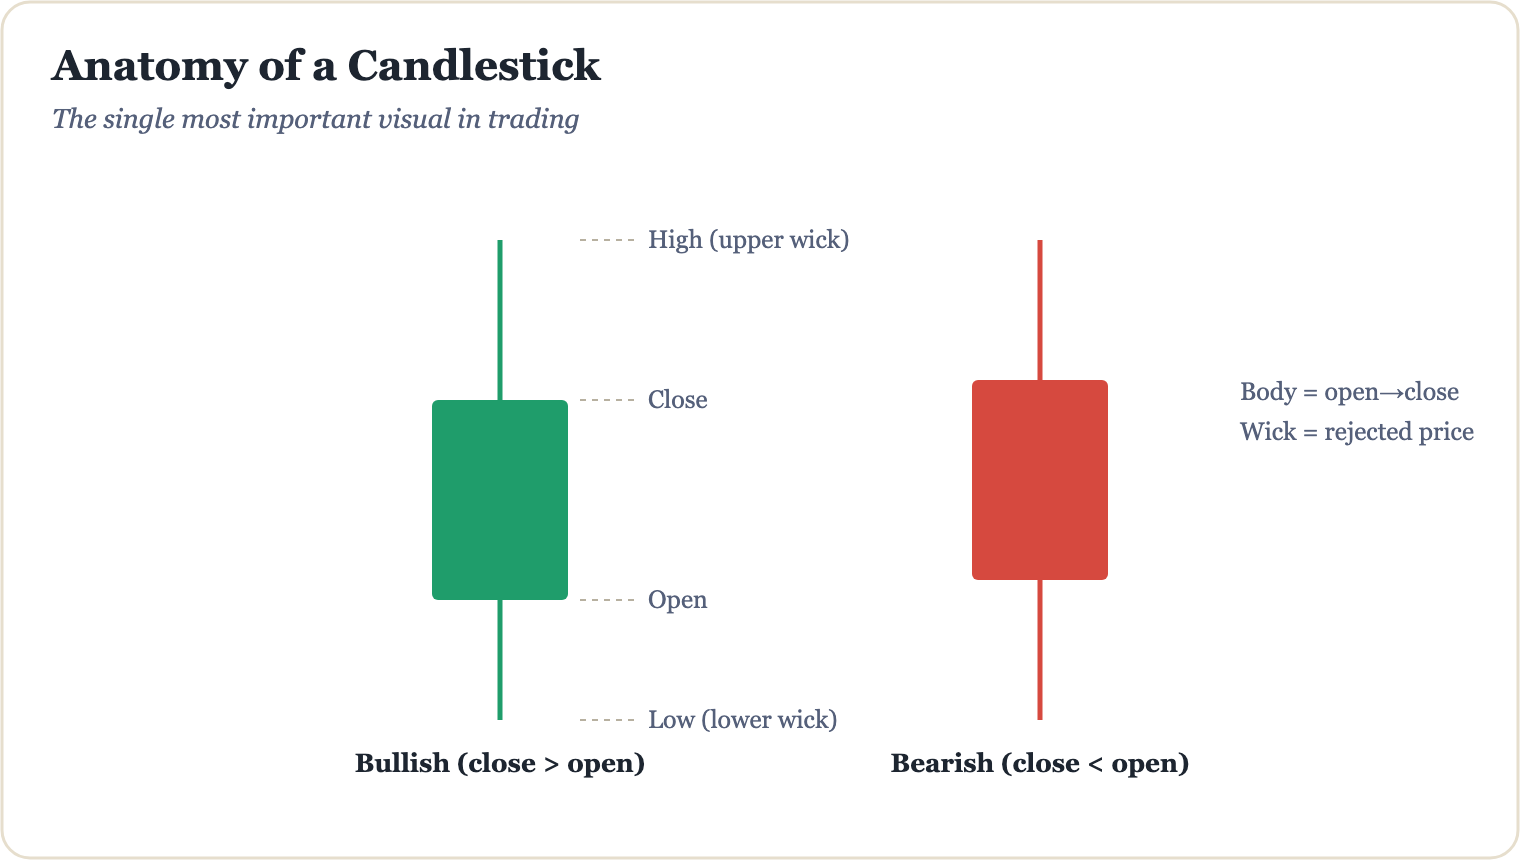
The Anatomy of a Candlestick Wick and What It Reveals
Candlestick wicks are more than just thin lines on a chart — they tell the story of rejected price levels, shifting momentum, and hidden market sentiment. Learn how to read them like a pro.
Jun 27, 2026 · 5 min read
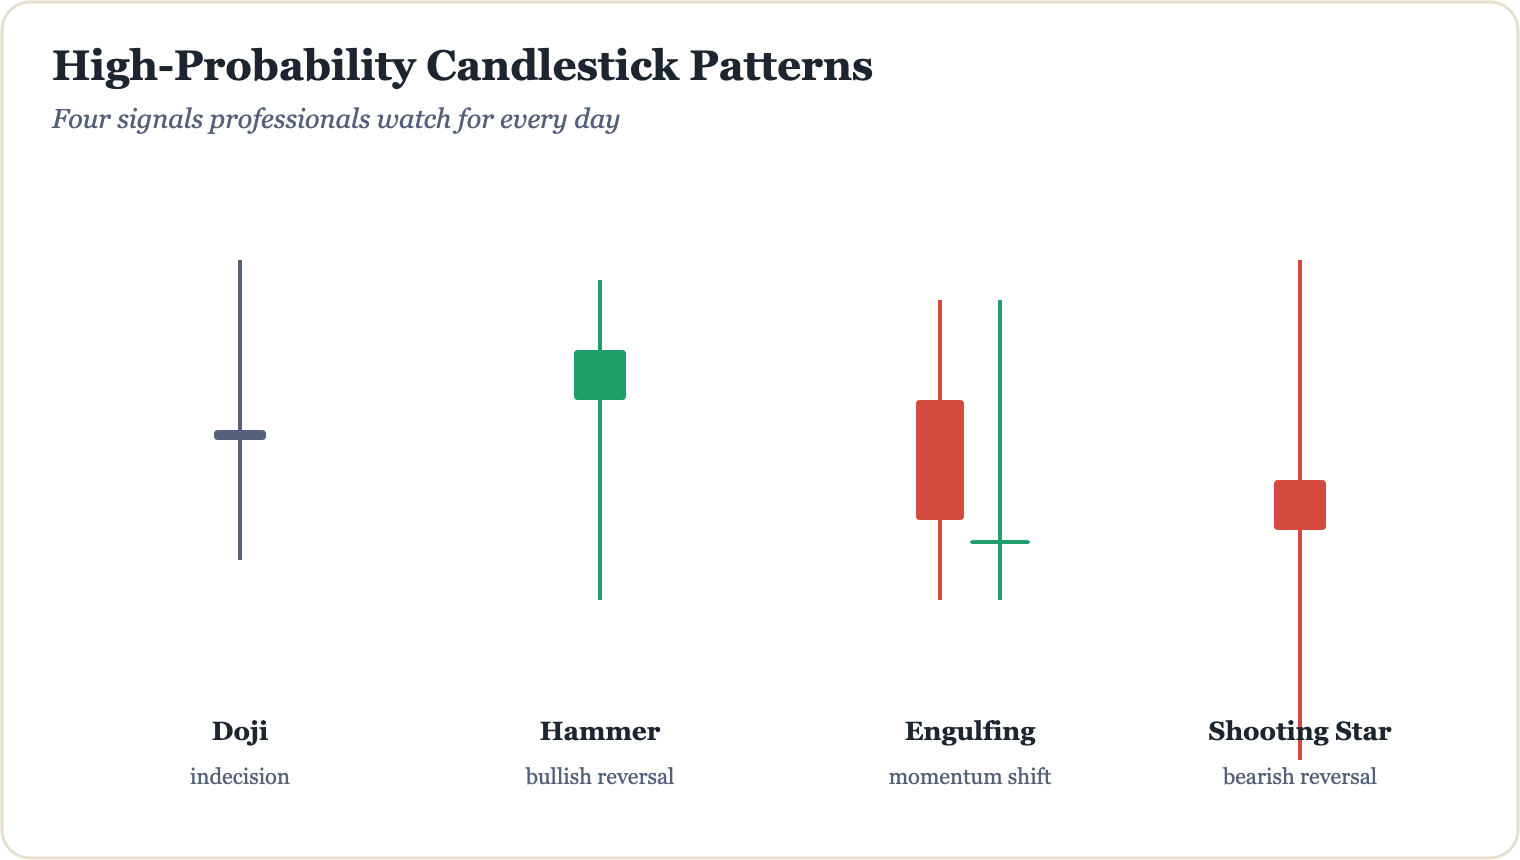
Doji Candles: Spotting Market Indecision
Learn how to read doji candles, understand what market indecision really looks like on a chart, and discover how traders use these signals as part of a broader technical analysis strategy.
Jun 27, 2026 · 5 min read
The Hammer and Shooting Star Reversal Candles
Learn how the hammer and shooting star candlestick patterns signal potential trend reversals, how to identify them correctly, and how to use them responsibly as part of a broader trading strategy.
Jun 26, 2026 · 5 min read
Bullish and Bearish Engulfing Patterns Explained
Learn how bullish and bearish engulfing candlestick patterns work, what they signal about market sentiment, and how traders use them as part of a broader technical analysis toolkit.
Jun 26, 2026 · 5 min read
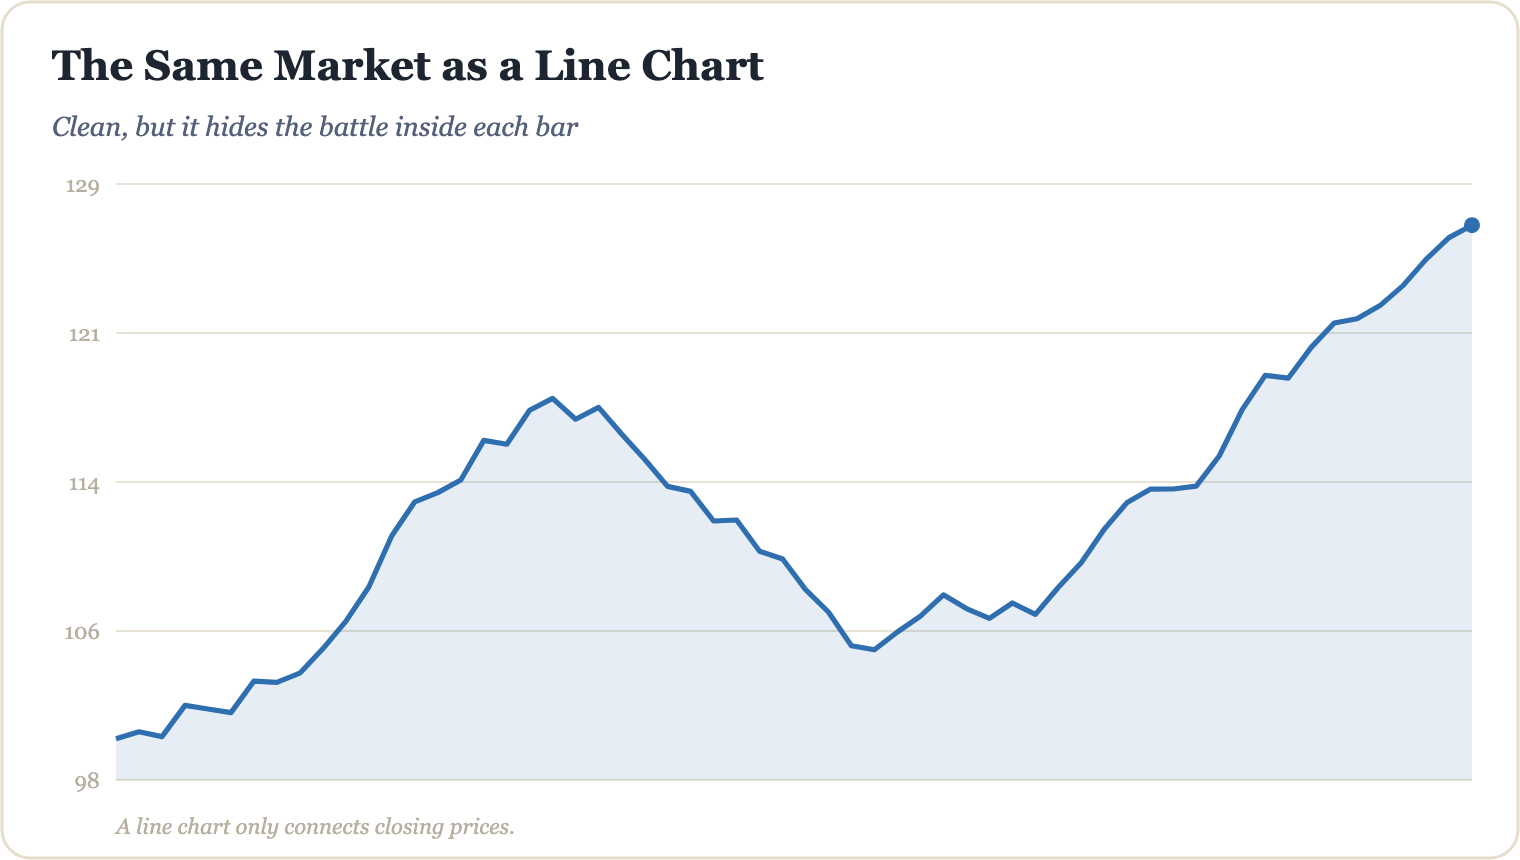
Line Charts vs Candlestick Charts: Which to Use
Line charts and candlestick charts each serve a different purpose in technical analysis. Learn which one to use, when to switch, and how both can sharpen your market reading skills.
Jun 26, 2026 · 5 min read
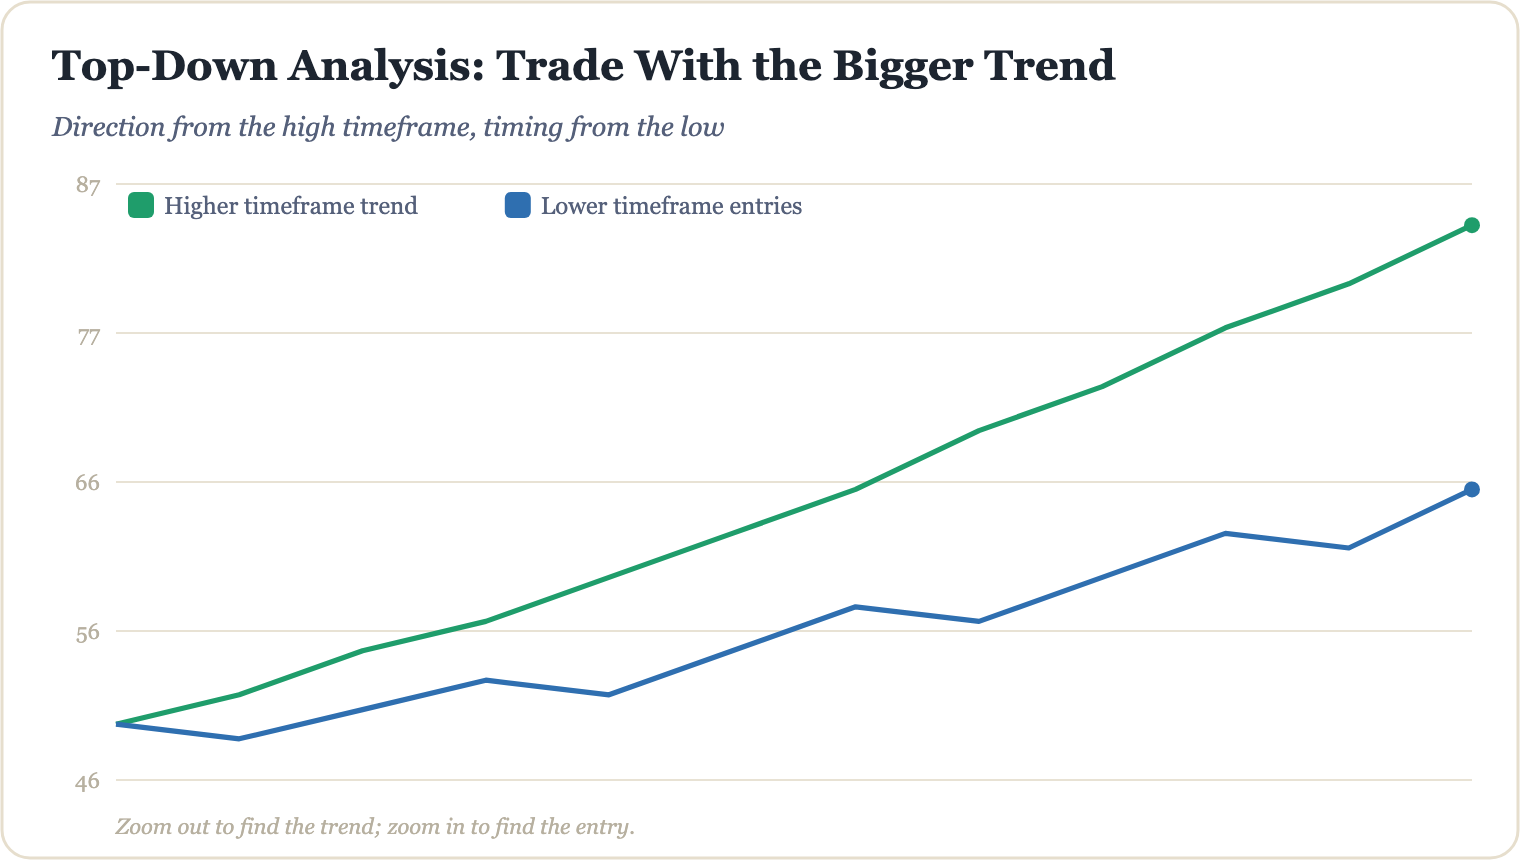
Multi-Timeframe Analysis: Top-Down Trading Explained
Learn how top-down trading using multi-timeframe analysis helps traders align their entries with the bigger market picture — a disciplined, structured approach to reading price action across different chart timeframes.
Jun 25, 2026 · 5 min read
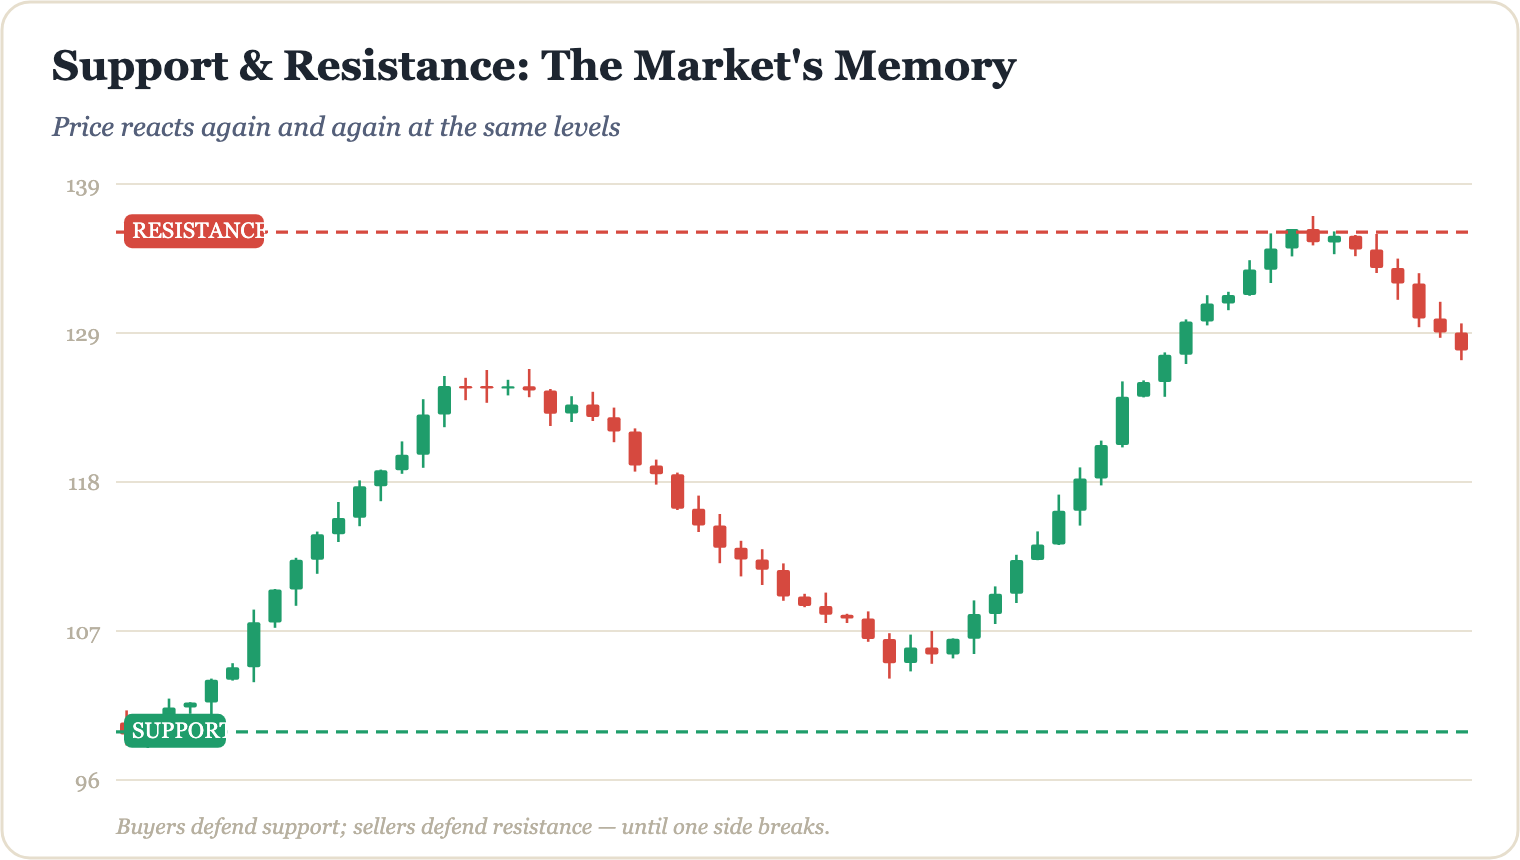
How to Mark Support and Resistance Like a Pro
Learn how professional traders identify and mark support and resistance levels with precision — including practical tips, common mistakes to avoid, and why these zones matter for managing risk.
Jun 25, 2026 · 5 min read
Why Broken Support Becomes Resistance
One of the most reliable concepts in technical analysis is role reversal — the idea that a broken support level doesn't disappear, it flips into resistance. Learn why this happens and how traders use it to structure their decisions.
Jun 25, 2026 · 4 min read
Reading Market Structure: Higher Highs and Higher Lows
Learn how to identify higher highs and higher lows to read market structure with confidence. A foundational technical analysis skill every beginner trader needs to understand before risking real capital.
Jun 24, 2026 · 5 min read
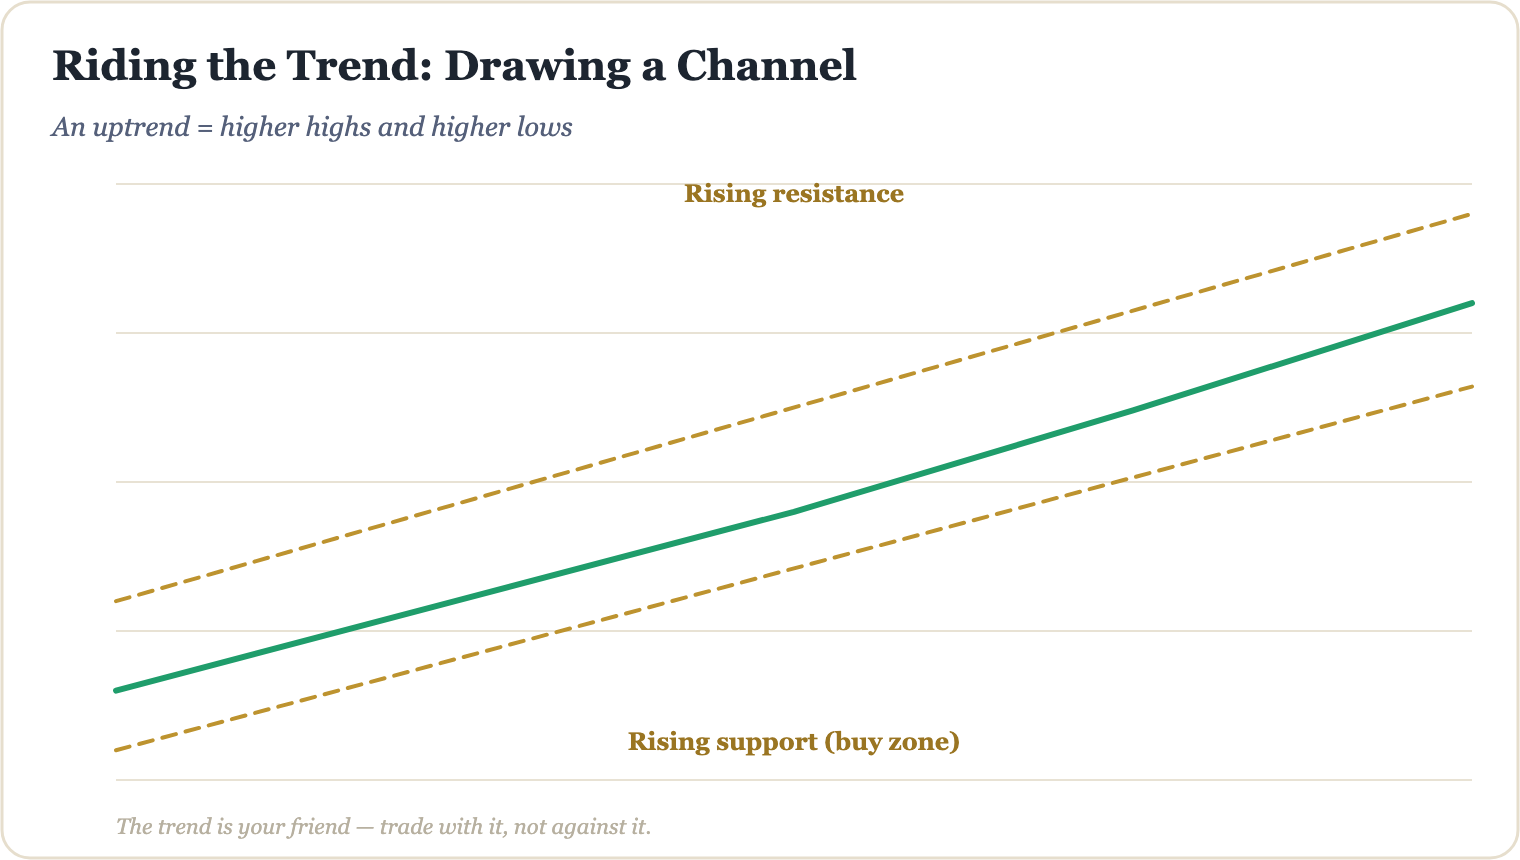
Trendlines and Channels: Drawing Them Correctly
Learn how to draw trendlines and price channels accurately so you can read market structure with confidence — no guesswork, no clutter, just clean technical analysis.
Jun 24, 2026 · 5 min read
Volume: the confirmation most beginners ignore
Price tells you what the market is doing. Volume tells you whether to believe it. Discover why volume is the most overlooked confirmation tool in technical analysis — and how to start using it today.
Jun 24, 2026 · 5 min read
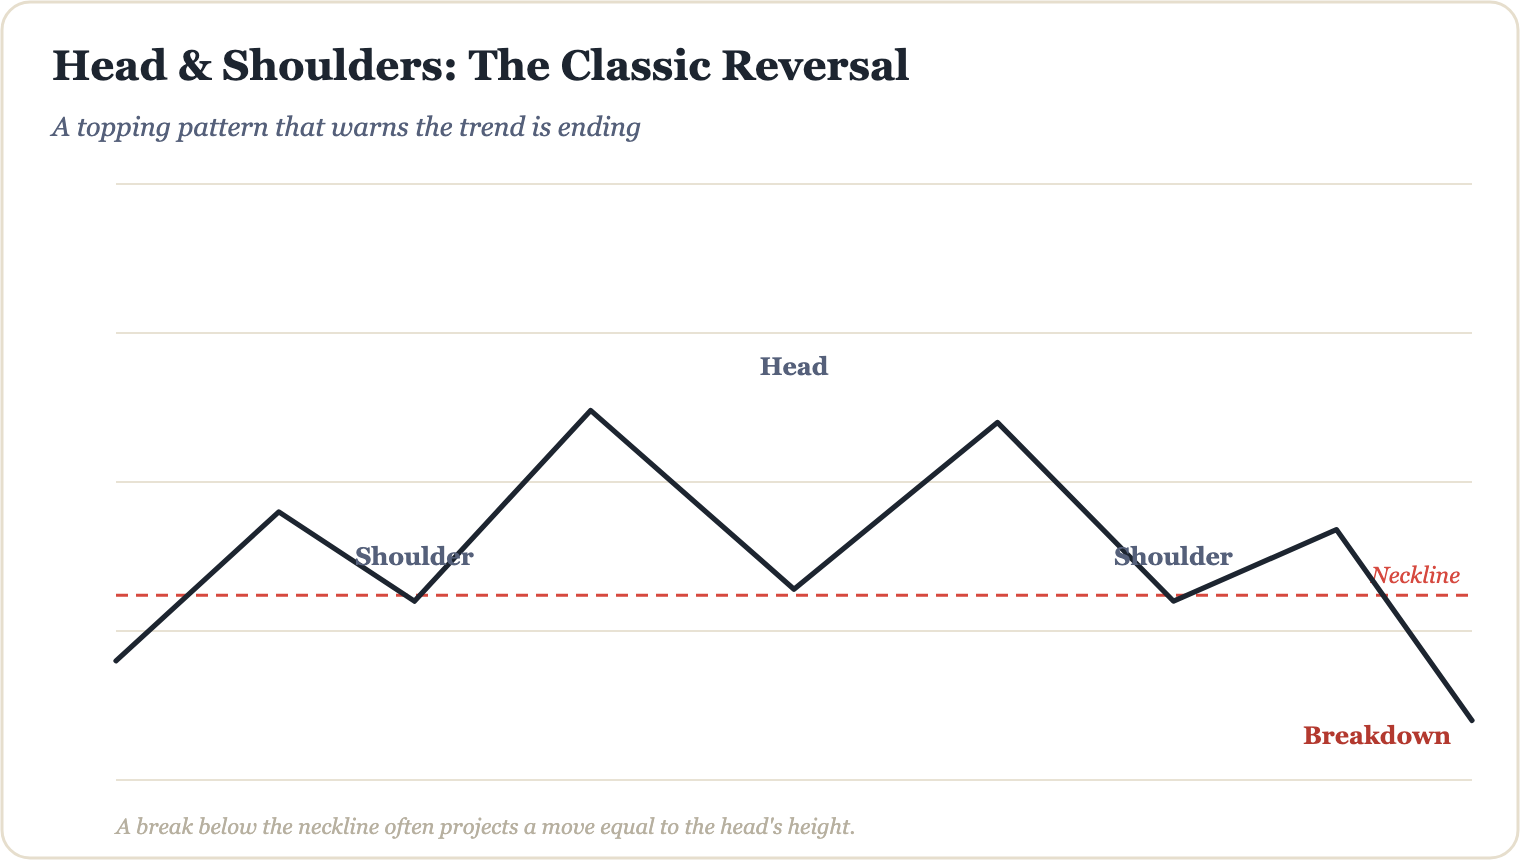
The Head and Shoulders Pattern, Step by Step
Learn how to identify and interpret the head and shoulders chart pattern step by step — one of the most reliable reversal signals in technical analysis.
Jun 23, 2026 · 5 min read
The Inverse Head and Shoulders Bottom
Learn how to identify and trade the inverse head and shoulders bottom pattern — one of the most reliable chart patterns for spotting potential trend reversals from bearish to bullish.
Jun 23, 2026 · 5 min read
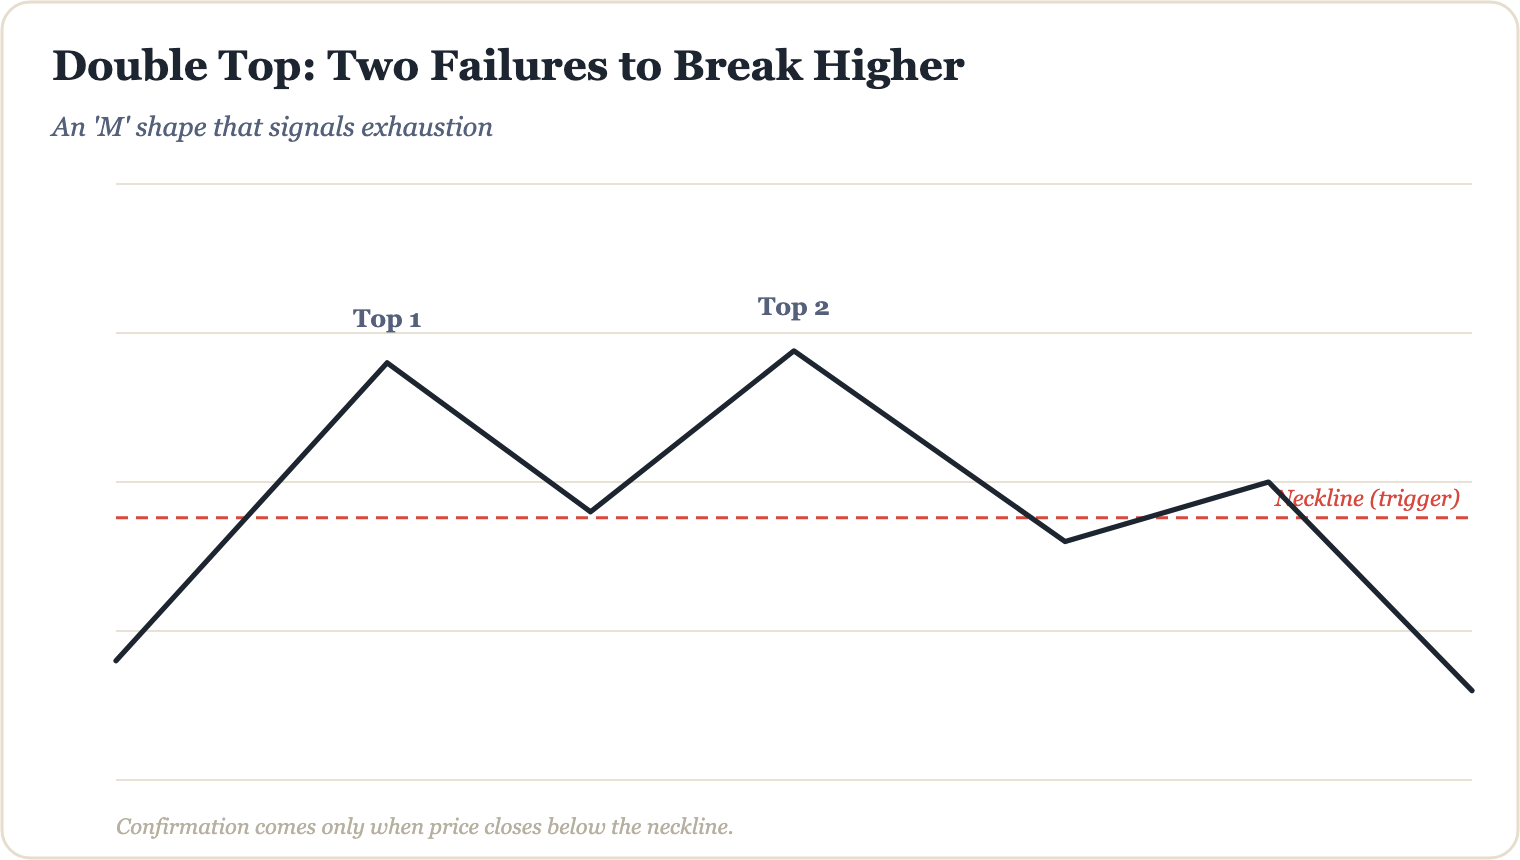
Double Top and Double Bottom Patterns
Learn how to identify and trade double top and double bottom chart patterns with clear examples, practical tips, and essential risk management guidance.
Jun 23, 2026 · 5 min read
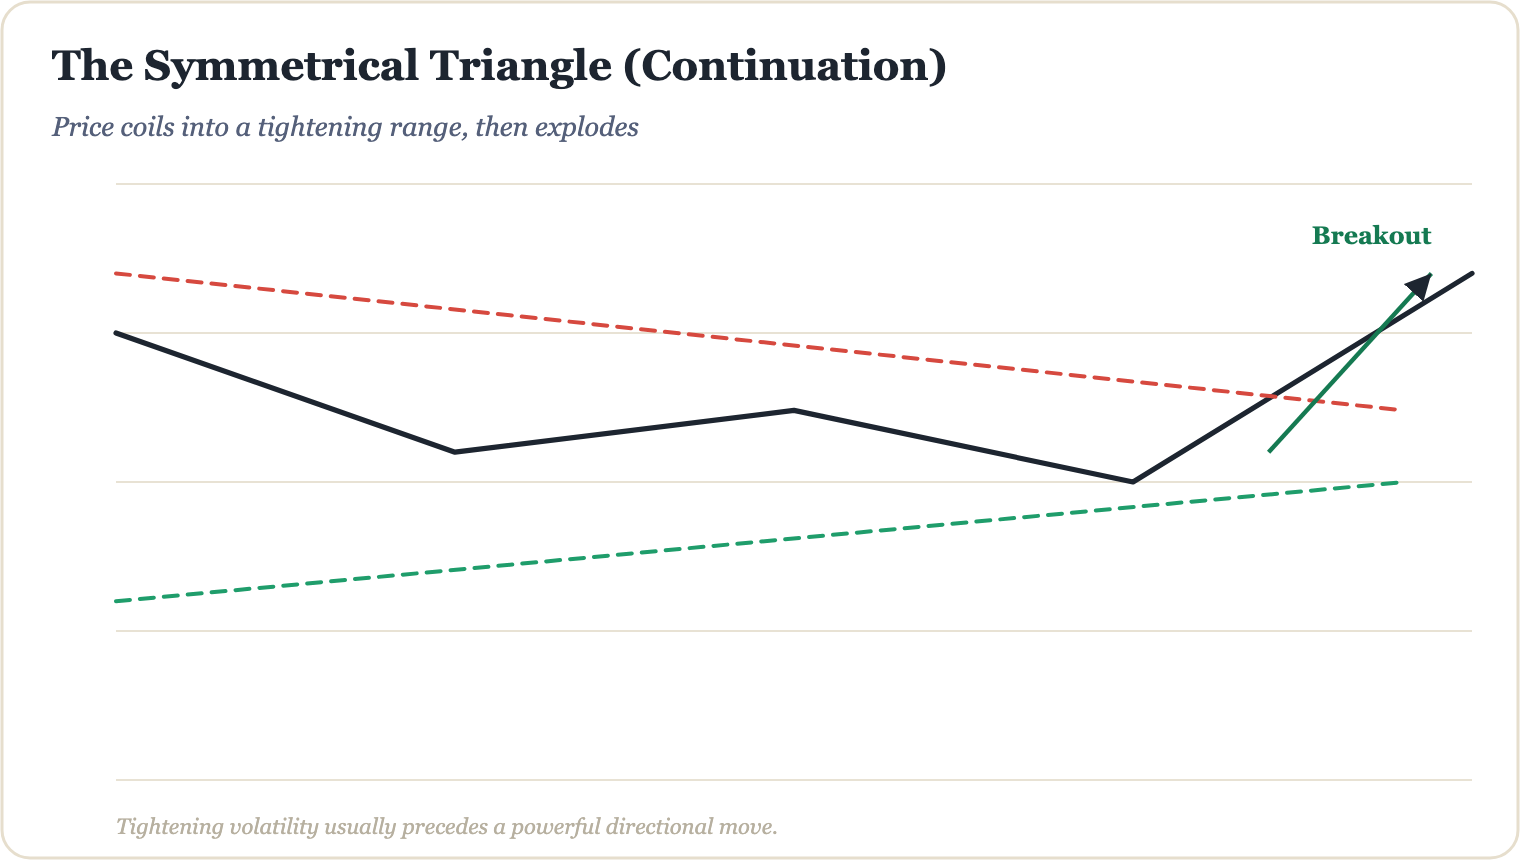
Symmetrical, Ascending and Descending Triangles: A Trader's Guide to Triangle Chart Patterns
Learn how to identify and interpret symmetrical, ascending, and descending triangle chart patterns — and understand what they may signal about future price action.
Jun 22, 2026 · 5 min read
Flags and Pennants: Trading the Continuation
Learn how to identify flags and pennants on a price chart, understand what they signal, and trade them with discipline — including real examples and key risk reminders.
Jun 22, 2026 · 5 min read
The Cup and Handle Pattern Explained
Learn how to identify and trade the cup and handle chart pattern — a classic technical setup that signals potential bullish continuation, with real examples and risk management tips.
Jun 22, 2026 · 5 min read