The Strategies blog
Practical, no-hype trading education — fresh insights published every day. Skim a strategy, then go deeper in the book.
Rising and Falling Wedges: How to Spot and Trade These Powerful Chart Patterns
Rising and falling wedges are among the most reliable reversal patterns in technical analysis. Learn how to identify them, understand what they signal, and approach them with a disciplined, risk-aware trading mindset.
Jun 21, 2026 · 5 min read
The Rounding Bottom (Saucer) Pattern
Discover how the rounding bottom (saucer) pattern works, what it signals on a price chart, and how traders use it to identify potential trend reversals — with real-world examples and key risk considerations.
Jun 21, 2026 · 5 min read
How to Trade a Range-Bound Market
Trending markets get all the glory, but range-bound conditions are where many traders quietly sharpen their edge. Learn how to identify, trade, and manage risk inside a consolidating market.
Jun 21, 2026 · 5 min read
Avoiding False Breakouts from Chart Patterns
False breakouts can trap even experienced traders. Learn how to identify and avoid them using volume confirmation, candlestick context, and smart entry timing.
Jun 20, 2026 · 5 min read
Moving Averages: SMA vs EMA Explained
Confused by SMA and EMA? Learn how these two essential moving averages work, how they differ, and how traders use them to read market trends — with clear, practical examples.
Jun 20, 2026 · 5 min read
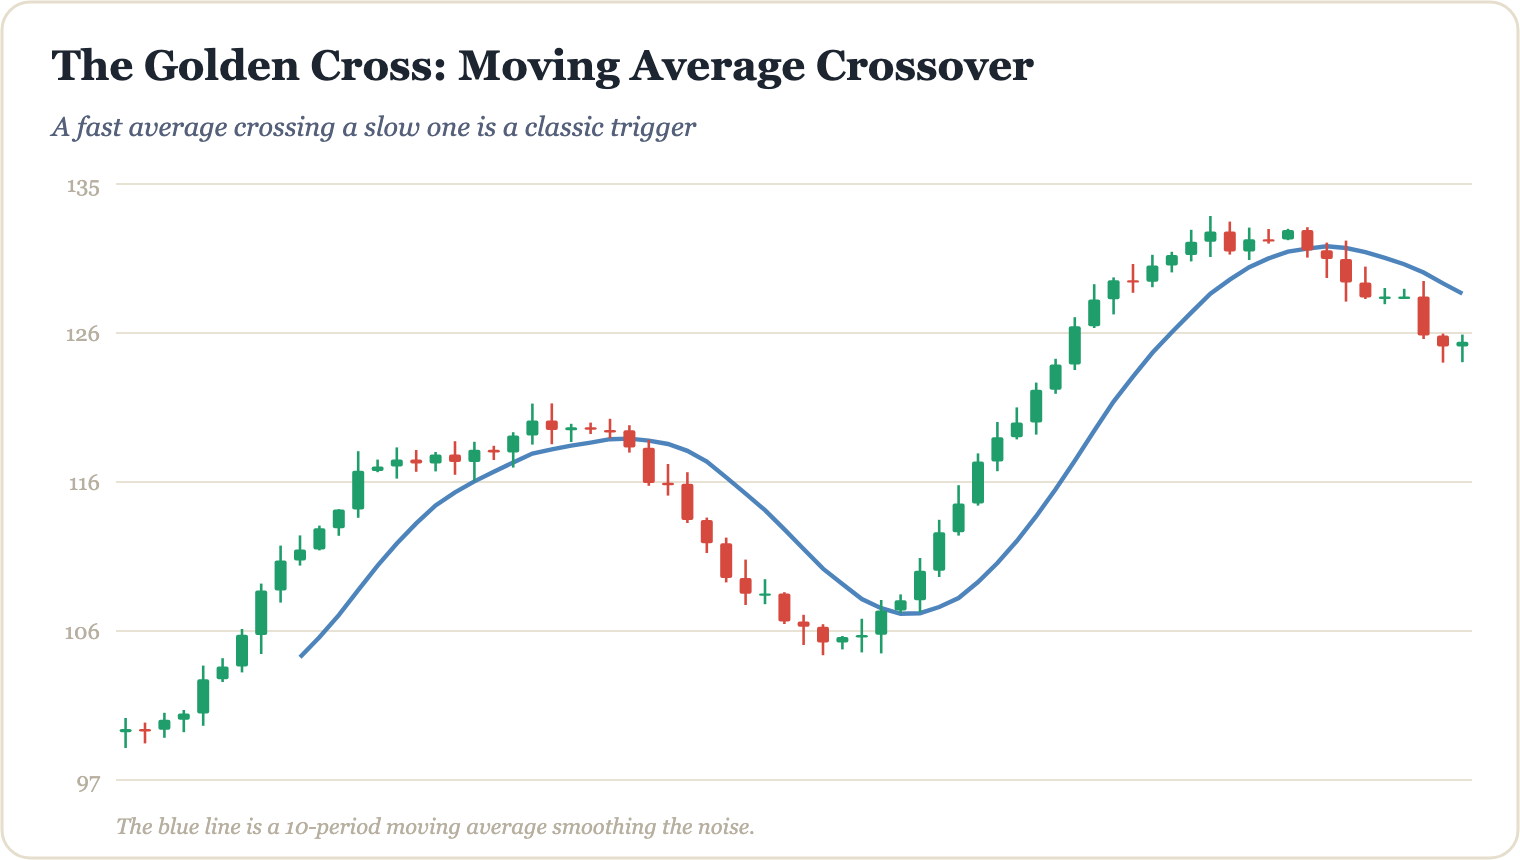
The Golden Cross and the Death Cross
Learn how the golden cross and death cross moving-average signals work, what they tell traders about momentum shifts, and how to use them responsibly as part of a broader strategy.
Jun 20, 2026 · 5 min read
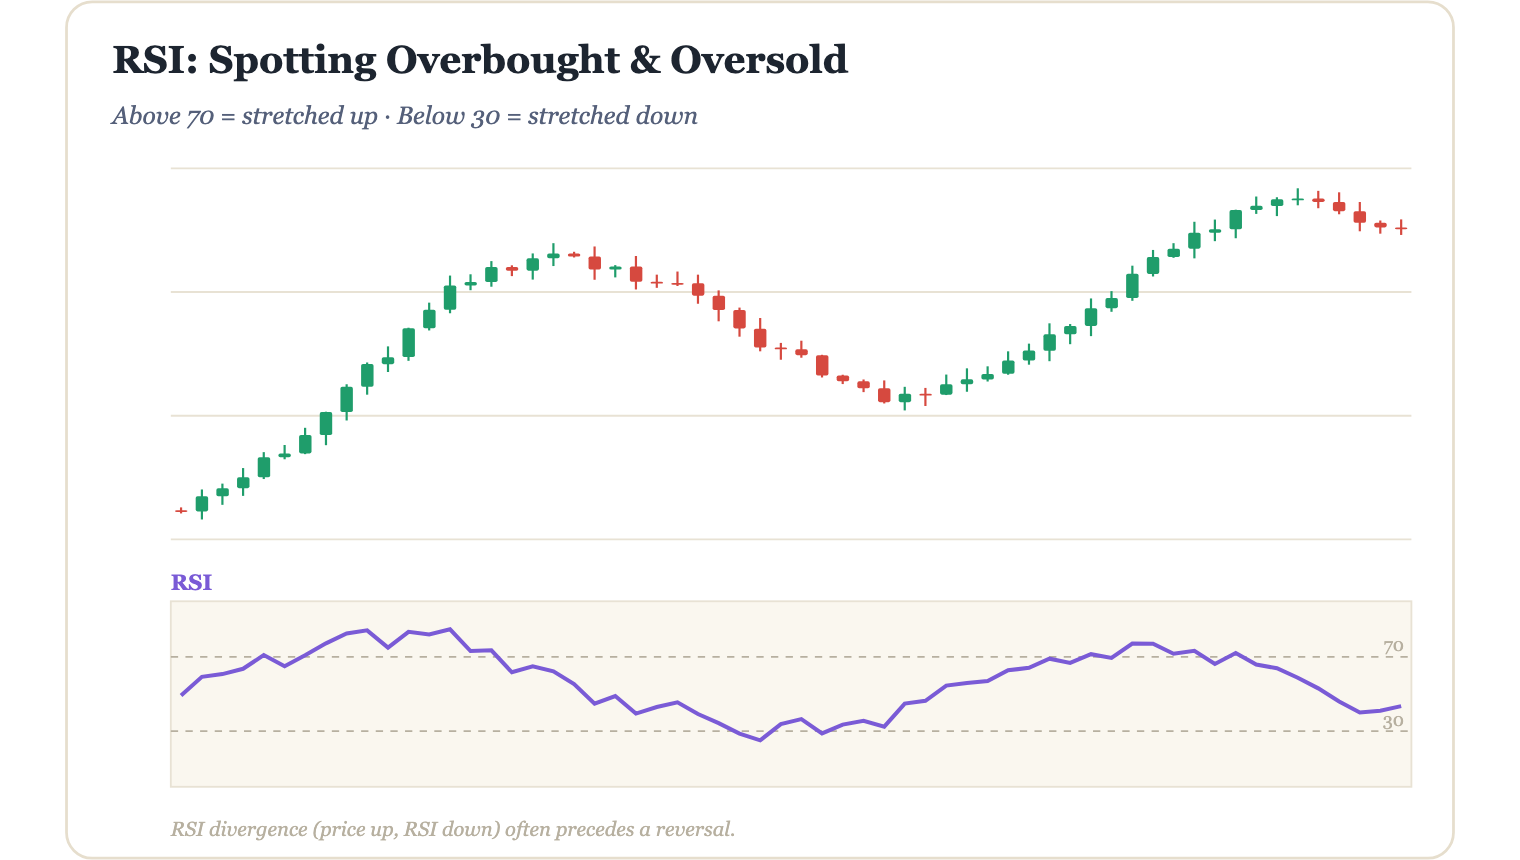
RSI Explained: Overbought and Oversold
Discover how the Relative Strength Index (RSI) works, what overbought and oversold signals really mean, and how traders use this popular indicator as part of a disciplined, risk-aware strategy.
Jun 19, 2026 · 5 min read
RSI Divergence: Spotting Reversals Early
Learn how RSI divergence can help you identify potential trend reversals before they happen — with real chart examples, clear explanations, and honest risk context for traders at every level.
Jun 19, 2026 · 5 min read
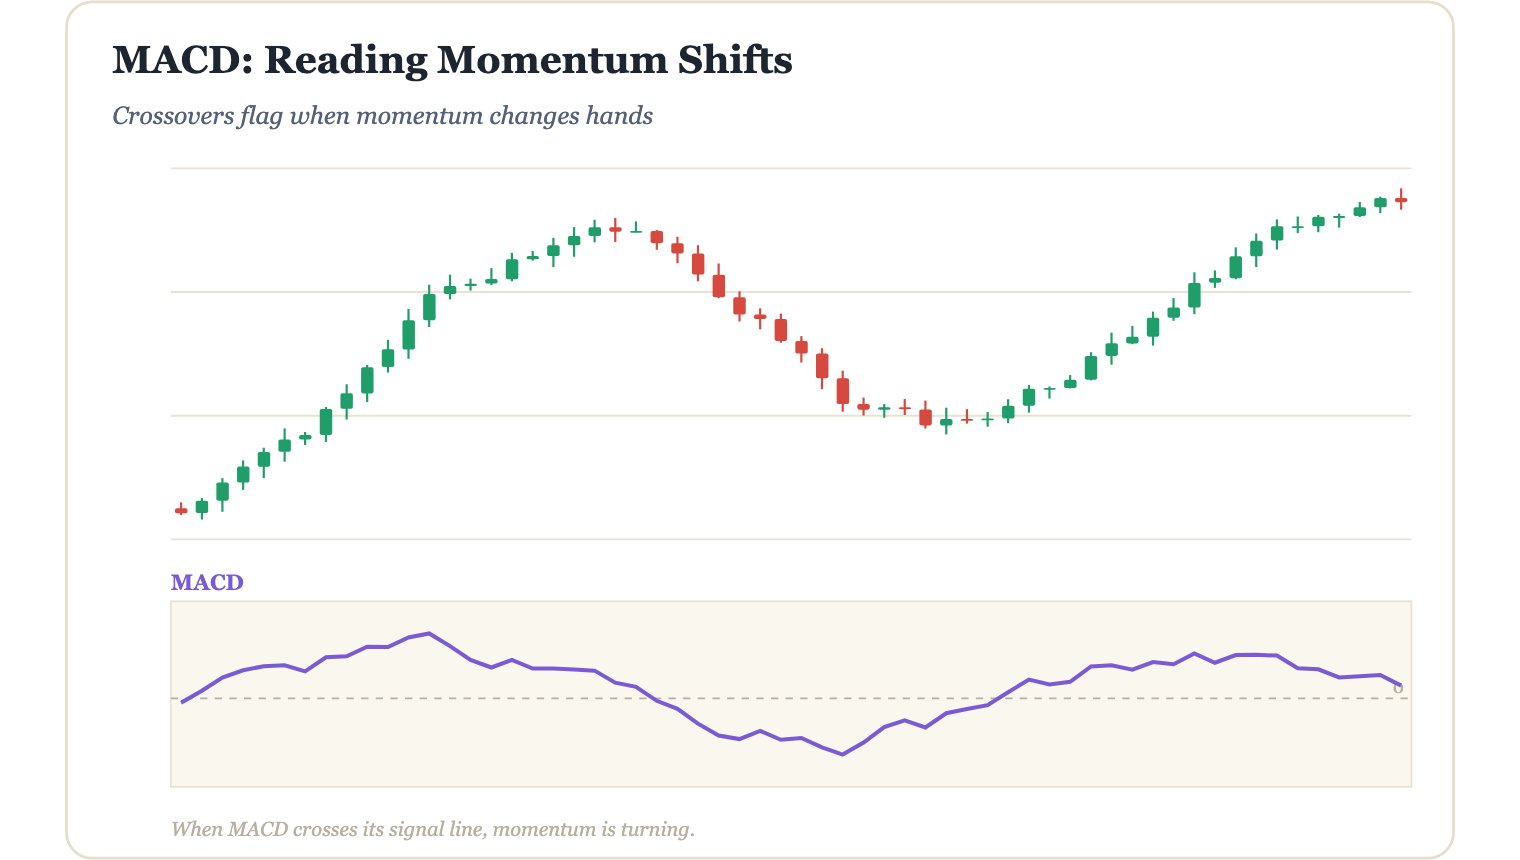
The MACD Indicator for Momentum Shifts
Learn how the MACD indicator works, how to read momentum shifts, and how traders use it to time entries and exits — with clear examples and honest risk guidance.
Jun 19, 2026 · 5 min read
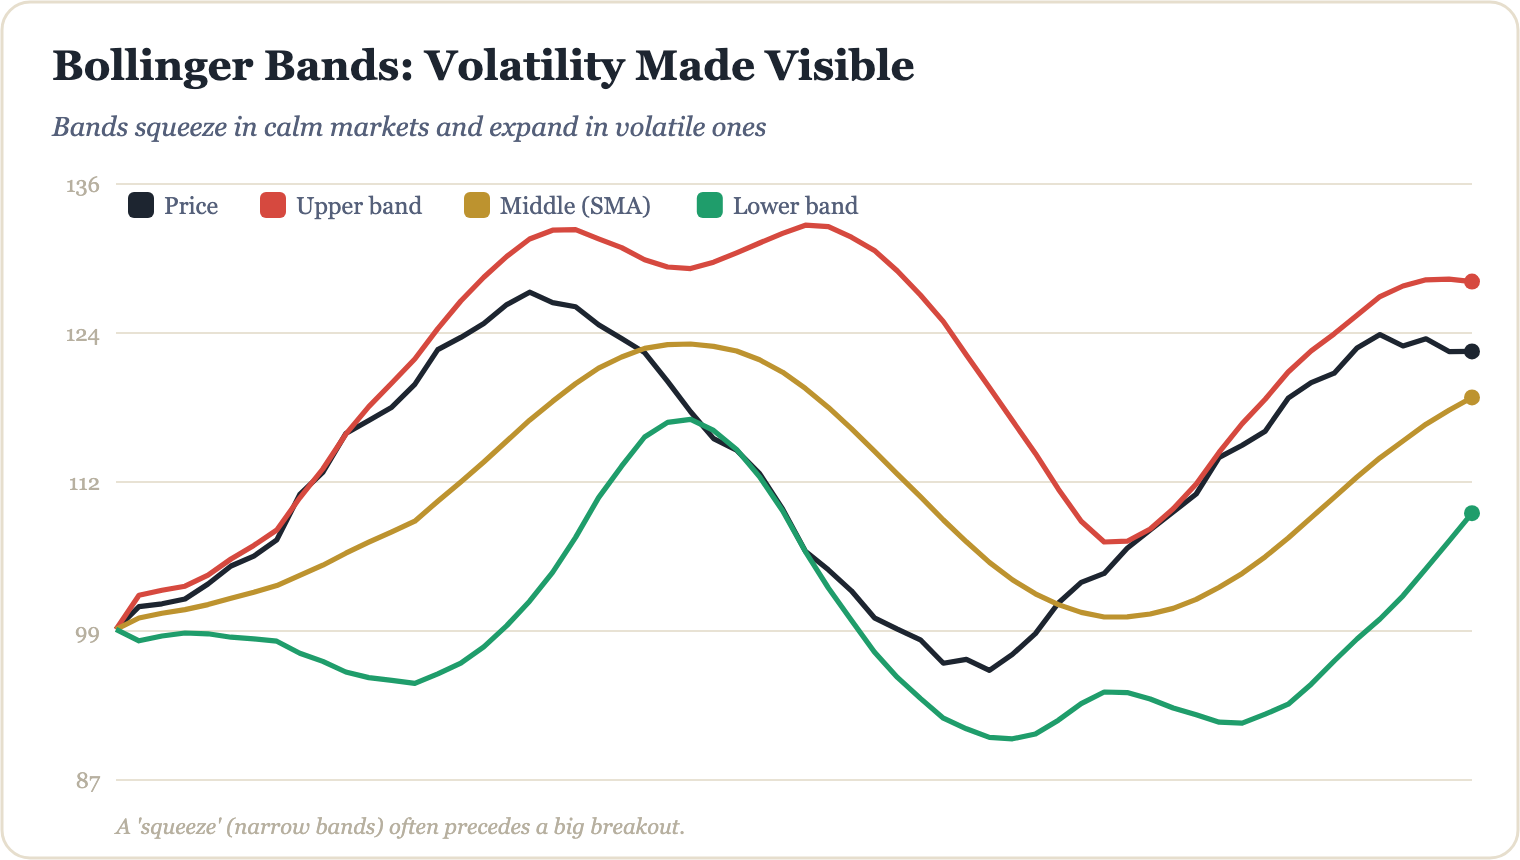
Bollinger Bands and the Volatility Squeeze: A Trader's Guide
Learn how Bollinger Bands measure market volatility and how the "squeeze" can signal high-probability trade setups — with practical examples and clear risk guidance for beginners.
Jun 18, 2026 · 5 min read
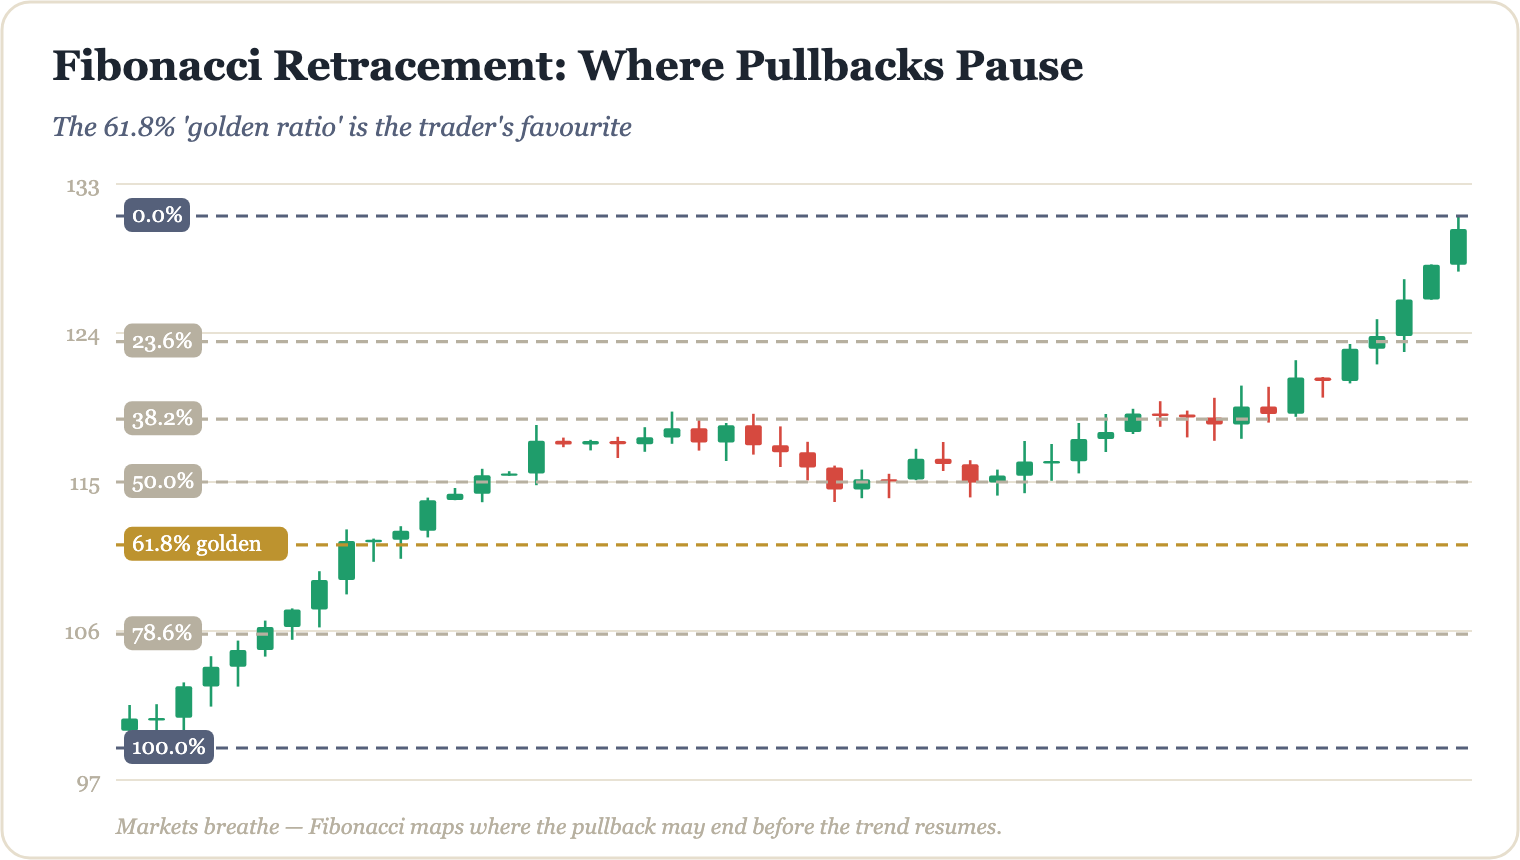
Fibonacci Retracement and the 61.8% Golden Level
Discover how traders use Fibonacci retracement levels — especially the powerful 61.8% "golden ratio" — to identify potential support, resistance, and high-probability entry zones on any chart.
Jun 18, 2026 · 5 min read
Combining Indicators Without Cluttering Your Chart
More indicators don't mean better signals. Learn how to build a clean, purposeful chart setup by combining the right tools without the noise — so you can read price action with clarity and confidence.
Jun 18, 2026 · 5 min read
The ATR Indicator for Measuring Volatility
Learn how the Average True Range (ATR) indicator helps traders measure market volatility, set smarter stop-losses, and size positions with discipline — no hype, just practical technique.
Jun 17, 2026 · 5 min read
The Stochastic Oscillator for Beginners
Learn how the stochastic oscillator works, how to read its signals, and how beginners can use it responsibly as part of a broader trading strategy.
Jun 17, 2026 · 5 min read
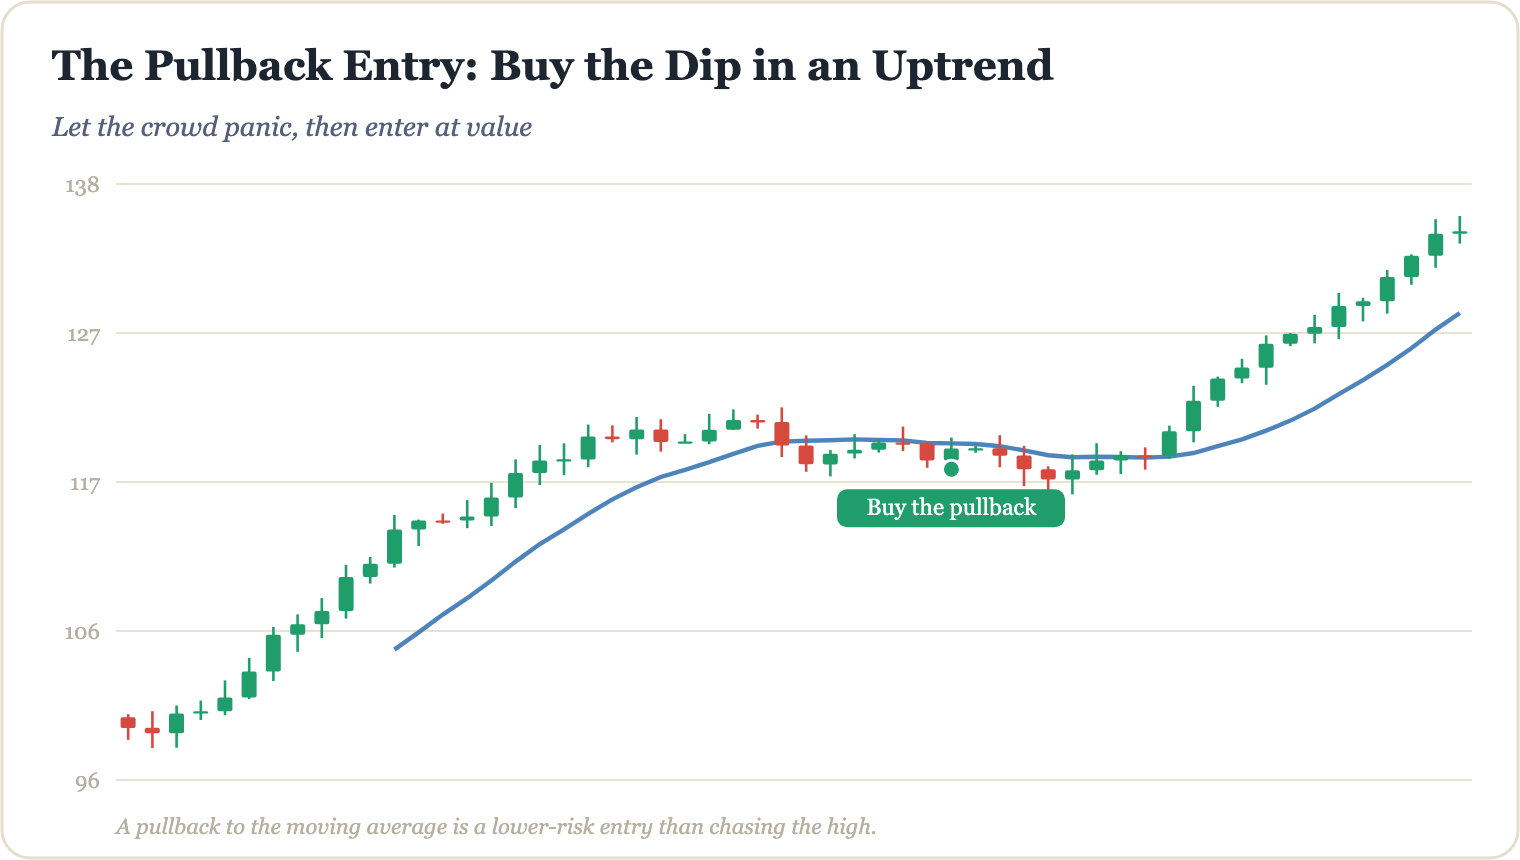
The Pullback Strategy: Buying the Dip in an Uptrend
Learn how the pullback strategy works, why traders use it to enter uptrends at better prices, and what risk management rules you need before placing a single trade.
Jun 17, 2026 · 5 min read
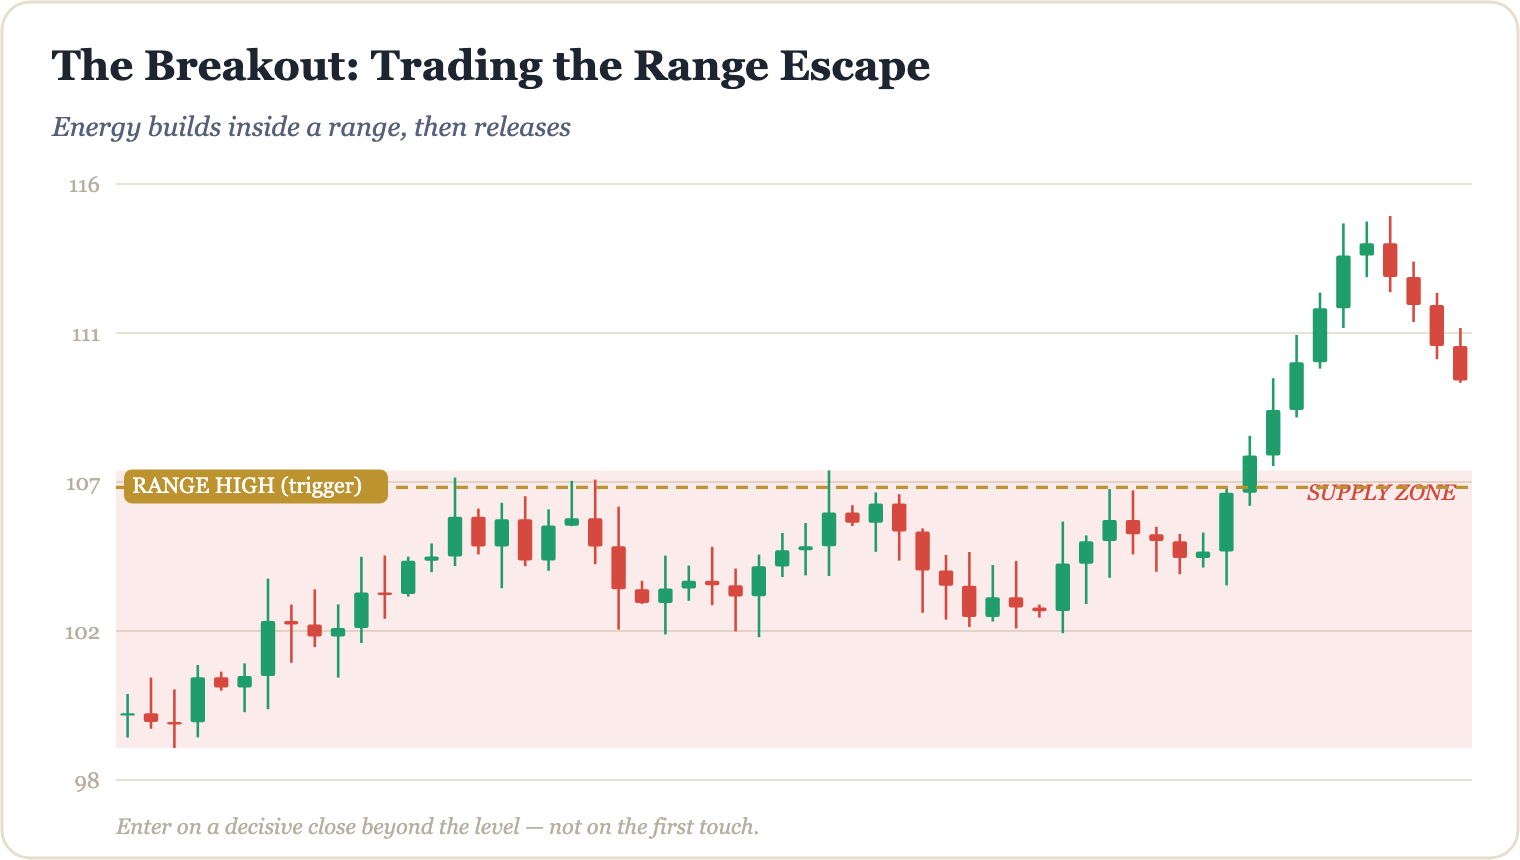
Breakout Trading Without Getting Trapped
Breakout trades look like easy wins — until the price snaps back and leaves you holding the bag. Learn how to filter real breakouts from fakeouts using volume, structure, and patient confirmation.
Jun 16, 2026 · 5 min read
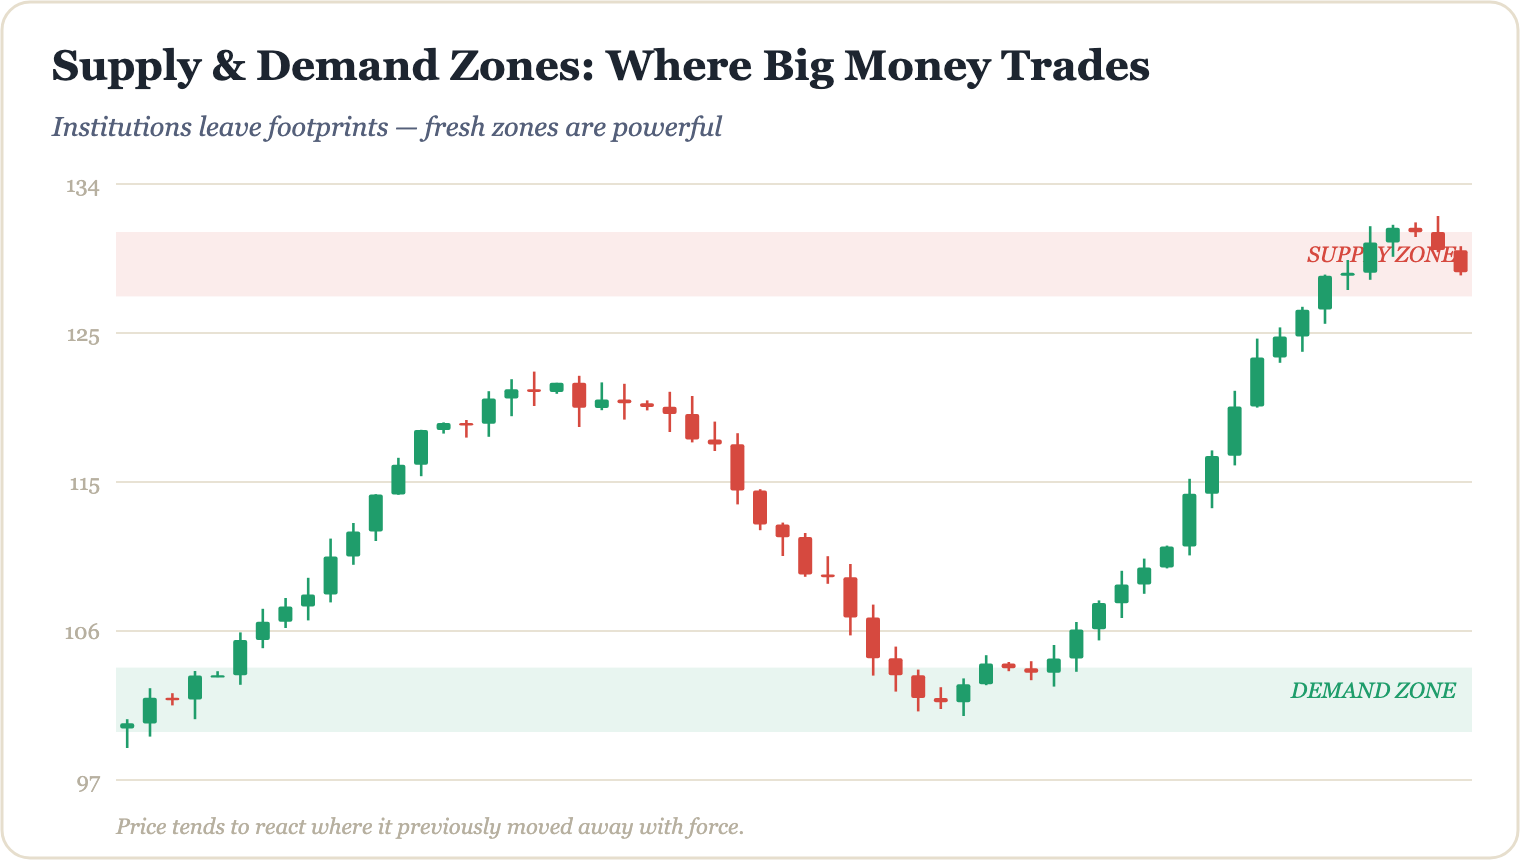
Supply and Demand Zones Explained
Learn what supply and demand zones are, how to identify them on a chart, and how traders use them as part of a structured, risk-aware trading strategy.
Jun 16, 2026 · 5 min read
Trend Following: Riding the Big Moves
Trend following is one of the oldest and most studied trading strategies in the market. Learn how it works, how traders apply it in practice, and what risks to keep in mind before you start.
Jun 16, 2026 · 5 min read