How to Read a Candlestick Chart in 30 Seconds
June 27, 2026 · 5 min read
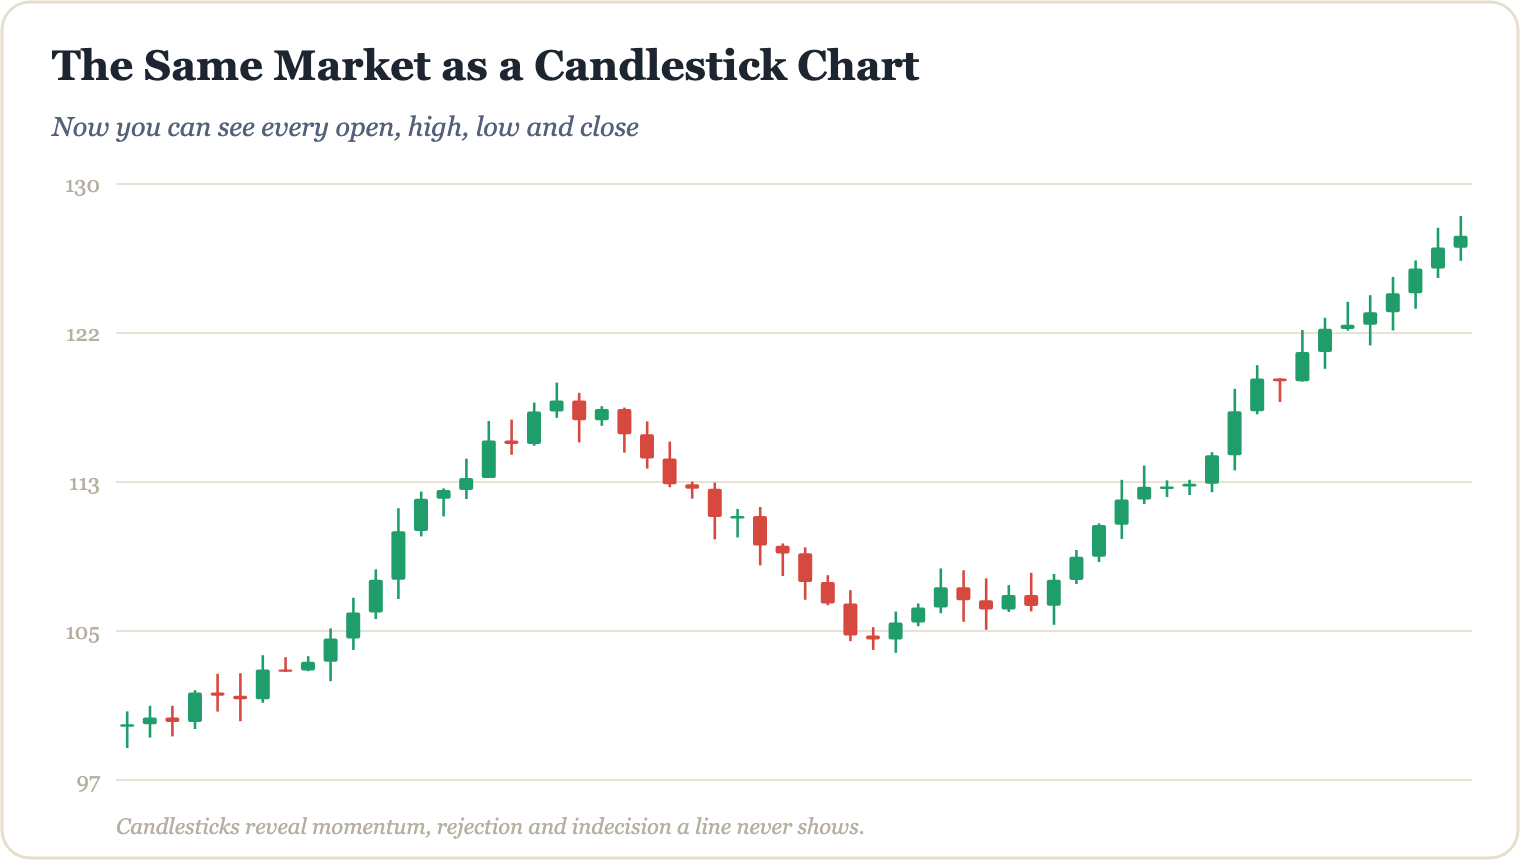
Candlestick charts look intimidating the first time you see them — a wall of red and green bars flickering across a screen. But here's the truth: each individual candle is only telling you four things, and once that clicks, you can read a chart's mood in the time it takes to sip your coffee. This guide breaks it down simply, practically, and without the noise.
What a Single Candle Is Actually Telling You
Every candlestick on a chart — whether it covers one minute or one month — represents a specific time period and encodes exactly four data points:
- Open: The price when the period began.
- Close: The price when the period ended.
- High: The highest price reached during the period.
- Low: The lowest price reached during the period.
The thick coloured part of the candle is called the body. It spans from the open to the close. The thin lines extending above and below are called wicks (or shadows), and they show the high and low. A green (or white) candle means the price closed higher than it opened — buyers were in control. A red (or black) candle means the price closed lower than it opened — sellers dominated.
For example, imagine you're looking at a daily candle for a stock. It opened at £100, climbed as high as £108, dipped as low as £97, and finally closed at £105. That single candle tells you buyers ultimately won the day, but sellers put up a real fight — all encoded in one bar.
The 30-Second Scan: What to Look for First
When you open a chart, resist the urge to dive into every candle. Instead, train your eyes to do a quick three-step scan:
- Step 1 — Trend direction: Are the candles generally stepping higher (uptrend), lower (downtrend), or moving sideways (range)? Zoom out to get the big picture before zooming in.
- Step 2 — Candle size: Large bodies signal strong conviction. Small bodies or candles where the wicks dominate signal indecision. A series of tiny, mixed candles in a tight range often precedes a breakout — in either direction.
- Step 3 — Wick behaviour: Long upper wicks mean buyers pushed the price up but sellers rejected it. Long lower wicks mean sellers pushed it down but buyers stepped in. Wicks reveal where price was refused, and that information matters.
"The candle doesn't lie — it simply shows you what actually happened between two points in time. Your job is to read it without adding a story you want to be true."
Two Patterns Worth Recognising Early On
You don't need to memorise 40 candlestick patterns to get started. Two are genuinely useful for beginners — but always remember that no pattern is a guarantee, and every trade carries risk.
The Doji
A Doji forms when the open and close are virtually the same price, leaving a very thin or invisible body with wicks on both sides. It signals indecision — neither buyers nor sellers gained clear control. When a Doji appears after a strong trend, it's worth paying attention, as momentum may be stalling. It's a question mark, not a signal on its own.
The Engulfing Candle
A bullish engulfing pattern occurs when a large green candle fully "engulfs" the body of the previous red candle — meaning buyers came back with enough force to overpower the prior session's selling. The bearish version is the opposite. These patterns carry more weight when they appear at recognisable support or resistance levels on the chart, rather than randomly in the middle of a move.
Putting It Together Without Overcomplicating It
The single biggest mistake beginners make is treating each candle as an isolated event. Candlesticks are most useful when read as part of a sequence — a conversation between buyers and sellers playing out over time. Start by identifying the trend, then note the size and wick behaviour of recent candles, and only then consider whether any individual pattern adds useful context. Keep your analysis simple. Complexity doesn't equal accuracy in trading; disciplined, consistent reading does.
If you'd like to go deeper — including how to combine candlestick reading with volume, moving averages, and structured trade planning — the full system is laid out step by step in The Millionaire Trader's AI Playbook, which covers everything from chart basics to building a rules-based approach to the markets.
Go from this article to a complete education.
The Millionaire Trader's AI Playbook — 200+ pages, English & Arabic.
Keep reading
The Anatomy of a Candlestick Wick and What It Reveals
Candlestick wicks are more than just thin lines on a chart — they tell the story of rejected price levels, shifting momentum, and hidden market sentiment. Learn how to read them like a pro.
Technical AnalysisDoji Candles: Spotting Market Indecision
Learn how to read doji candles, understand what market indecision really looks like on a chart, and discover how traders use these signals as part of a broader technical analysis strategy.
Technical AnalysisThe Hammer and Shooting Star Reversal Candles
Learn how the hammer and shooting star candlestick patterns signal potential trend reversals, how to identify them correctly, and how to use them responsibly as part of a broader trading strategy.