Doji Candles: Spotting Market Indecision
June 27, 2026 · 5 min read
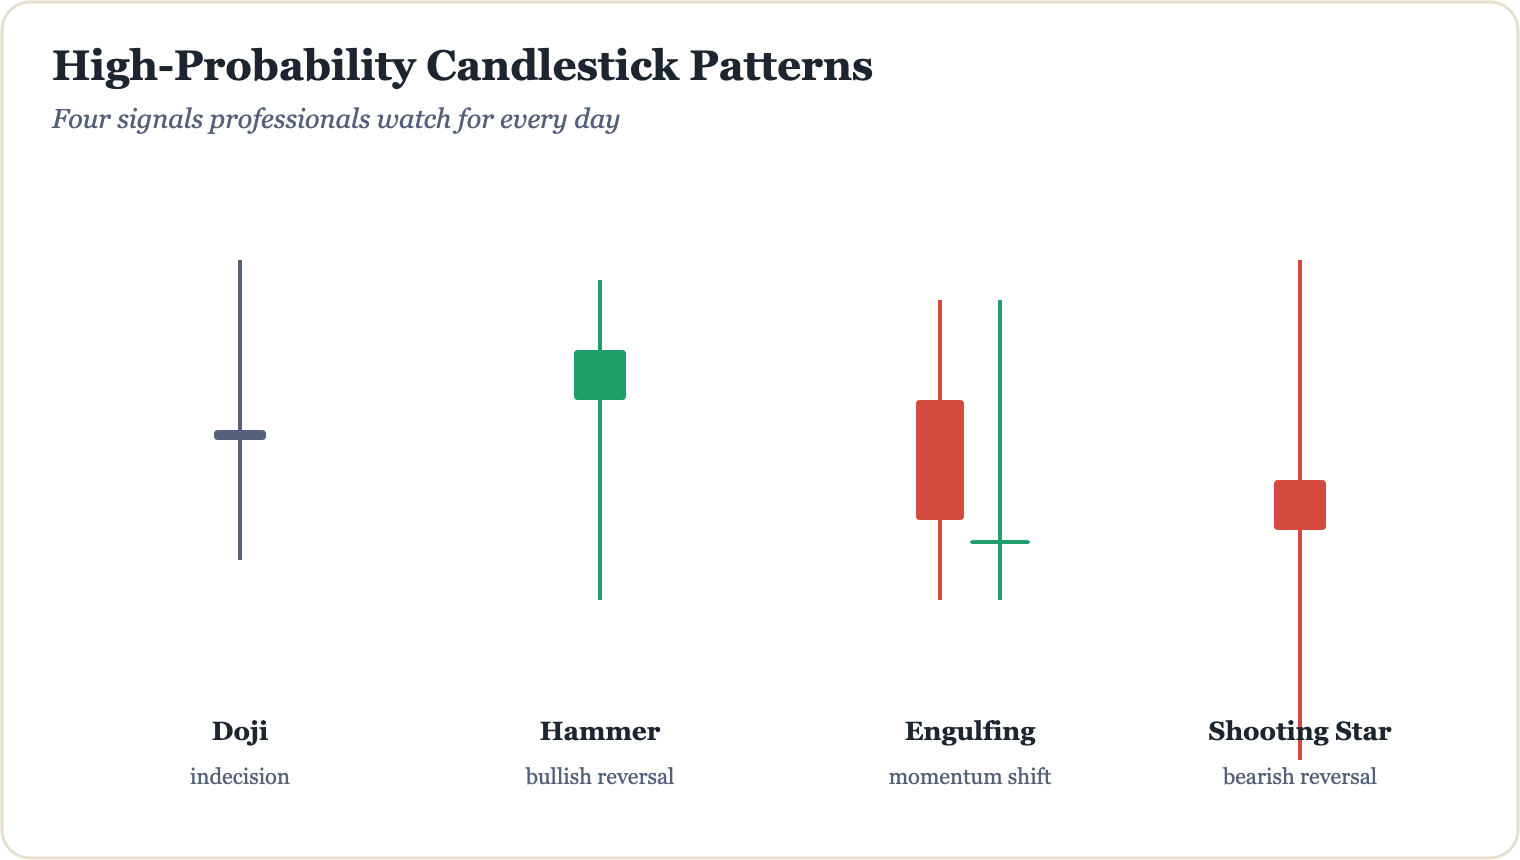
Every price chart tells a story, and some of the most revealing chapters are written in a single candle. The doji candlestick is one of technical analysis's most recognisable patterns — a small, cross-like shape that signals a tug-of-war between buyers and sellers. Understanding what a doji means, and crucially what it doesn't guarantee, can sharpen how you read market context and make more informed trading decisions.
What Is a Doji Candle?
A doji forms when a candle's opening price and closing price are virtually the same, leaving little to no real body. What you're left with are the upper and lower wicks (also called shadows), which show that price moved both up and down during the session but ultimately returned to where it started. This equilibrium between buying and selling pressure is the visual definition of indecision.
There are several common doji varieties worth knowing:
- Standard Doji: A thin or non-existent body with roughly equal wicks on both sides.
- Long-Legged Doji: Unusually long upper and lower wicks, indicating extreme volatility and indecision within the session.
- Gravestone Doji: A long upper wick with little or no lower wick — price rallied but was fully rejected by sellers.
- Dragonfly Doji: The opposite — a long lower wick with little or no upper wick, suggesting buyers absorbed heavy selling pressure.
Reading Dojis in Context: Real-World Examples
A doji on its own is not a trading signal — it is a question mark, not an answer. Context is everything. Consider these two scenarios:
Scenario 1: Doji After a Strong Uptrend
Imagine a stock has climbed steadily for five sessions, each candle closing higher than the last. On the sixth session, a gravestone doji appears. Buyers pushed price up during the day, but sellers drove it all the way back down to the open. This pattern — a doji appearing after a prolonged move — can be a meaningful warning that bullish momentum is fading. Traders often look for a bearish confirmation candle on the following session before considering any position, and always with a defined stop-loss in place.
Scenario 2: Dragonfly Doji at a Support Level
Now picture a currency pair that has been falling and hits a well-established horizontal support zone. A dragonfly doji forms: price dipped sharply lower during the session, but buyers stepped in and pushed the close back up to the open. Combined with the support level, this may suggest selling pressure is exhausting itself. Again, no candle pattern removes risk — a break below that support invalidates the setup entirely, which is why stop-loss placement is non-negotiable.
"A doji tells you the market is asking a question. Your job as a trader is to wait for the answer — not to assume you already know it."
Common Mistakes Traders Make With Dojis
Many beginners treat every doji as an automatic reversal signal, which can lead to costly errors. Here are the most frequent pitfalls:
- Ignoring the trend: A doji in the middle of a sideways, low-volume market carries far less significance than one appearing at a key price level.
- Skipping confirmation: Acting on a doji without waiting for the next candle to confirm direction increases the probability of entering a false signal.
- Overlooking volume: A doji formed on unusually high volume carries more weight, as it reflects genuine conflict between a large number of participants.
- Using dojis in isolation: The most effective technical analysis layers multiple tools — support and resistance, trend direction, momentum indicators — rather than relying on any single pattern.
Dojis as One Piece of a Larger Puzzle
Doji candles are best understood as alerts, not instructions. They prompt you to pause, zoom out, and assess whether the broader market structure supports a potential shift in direction. When a doji aligns with a significant support or resistance level, a Fibonacci retracement zone, or a divergence on the RSI, the confluence of signals becomes far more meaningful than any single pattern alone. Even then, no setup comes with certainty — risk management through position sizing and stop-losses remains the foundation of any sound trading approach.
If you want to explore how doji candles fit into a complete, structured trading methodology — including how to combine them with trend filters, volume analysis, and entry timing — the full framework is laid out step by step in The Millionaire Trader's AI Playbook, where technical patterns like these are placed within a practical, rules-based system designed to build genuine skill over time.
Go from this article to a complete education.
The Millionaire Trader's AI Playbook — 200+ pages, English & Arabic.
Keep reading
How to Read a Candlestick Chart in 30 Seconds
Candlestick charts look intimidating at first — but once you know what each part means, you can absorb a market's story at a glance. Here's how to do it in 30 seconds flat.
Technical AnalysisThe Anatomy of a Candlestick Wick and What It Reveals
Candlestick wicks are more than just thin lines on a chart — they tell the story of rejected price levels, shifting momentum, and hidden market sentiment. Learn how to read them like a pro.
Technical AnalysisThe Hammer and Shooting Star Reversal Candles
Learn how the hammer and shooting star candlestick patterns signal potential trend reversals, how to identify them correctly, and how to use them responsibly as part of a broader trading strategy.