The Anatomy of a Candlestick Wick and What It Reveals
June 27, 2026 · 5 min read
Every candlestick on a price chart is a compressed story — a battle between buyers and sellers fought within a single time period. Most beginners focus on the candle's body, but it's the wicks (also called shadows) that often carry the most revealing information. Understanding what a wick represents, and why it formed where it did, is one of the most practical skills you can develop in technical analysis.
What Exactly Is a Candlestick Wick?
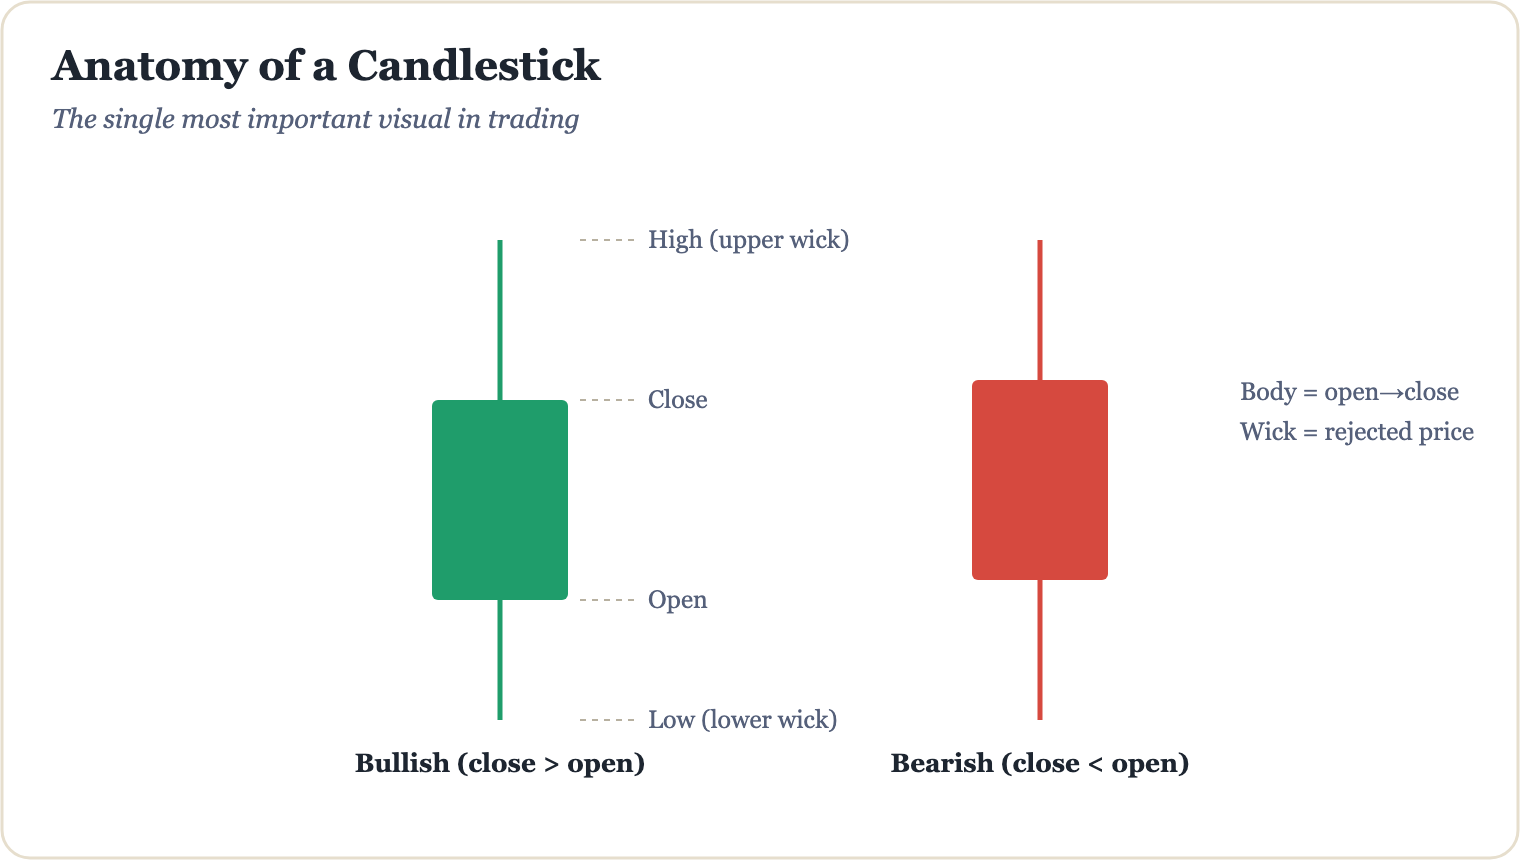
A candlestick is made up of two parts: the body, which represents the range between the open and close price, and the wicks, which extend above and below the body to show the highest and lowest prices reached during that period. The upper wick stretches from the top of the body to the session high, while the lower wick stretches from the bottom of the body to the session low.
Here's the critical insight: a wick marks a price level that the market visited but ultimately rejected. When price travels up to a certain level and then retreats before the candle closes, it leaves behind an upper wick. That rejection is a footprint of selling pressure. The same logic applies in reverse for lower wicks and buying pressure.
What Different Wicks Reveal About Market Sentiment
The length, position, and context of a wick all carry meaning. Here are the three most common patterns traders study:
- Long upper wick, small body: Buyers pushed price significantly higher during the session, but sellers stepped in and drove it back down before the close. This signals potential bearish reversal pressure, especially near a known resistance level. A classic example is the shooting star pattern on a daily chart — a single candle that can mark the exhaustion of an uptrend.
- Long lower wick, small body: The opposite scenario. Sellers drove price sharply lower, but buyers absorbed that pressure and pushed it back up. This is the structure behind the hammer candle — one of the most studied bullish reversal signals in technical analysis, particularly powerful when it forms after a sustained downtrend.
- Wicks on both sides (spinning top or doji): Price explored territory in both directions but closed near where it opened. This indecision candle often signals a pause or potential turning point in a trend, though it requires confirmation from the following candle before acting on it.
"The wick doesn't lie. It shows you exactly where the market said 'no' — and in trading, knowing where price was rejected is often more valuable than knowing where it went."
Reading Wicks in Context: Why Location Matters
A long wick in isolation means relatively little. Its true value emerges when you consider where it formed on the chart. A lower wick touching a well-established support zone carries far more weight than the same wick appearing in the middle of a range with no structural significance. Similarly, an upper wick that pokes above a previous swing high and snaps back is a much stronger rejection signal than one forming in open air.
For example, imagine a stock that has been rallying for several sessions and approaches a resistance level at $150. A daily candle forms with its body between $145 and $147, but the upper wick reaches all the way to $151 before closing back at $147. That wick tells you: buyers tried to break through $150, sellers defended it aggressively, and the close back inside the range suggests the resistance held. This kind of evidence informs risk management decisions — such as where to consider placing a stop-loss — not just entry signals. Always remember that no single candle pattern guarantees a specific outcome; risk is always present.
Common Mistakes Beginners Make With Wicks
One of the most frequent errors is treating every long wick as an immediate trade signal. Context, confluence, and confirmation are essential. A hammer forming after a five-candle downtrend on high volume is a very different proposition from the same pattern appearing mid-consolidation on thin volume. Additionally, many beginners ignore the wick-to-body ratio — a wick that is two to three times the length of the body is significantly more meaningful than one only slightly longer than the body.
Wicks are one piece of a larger analytical puzzle. When combined with volume analysis, support and resistance levels, and trend structure, they become a genuinely powerful tool for understanding price behaviour and making more informed, disciplined trading decisions. A deeper breakdown of how to integrate wick analysis into a full technical framework — including entry criteria, stop placement, and trade management — is covered step by step in The Millionaire Trader's AI Playbook.
Go from this article to a complete education.
The Millionaire Trader's AI Playbook — 200+ pages, English & Arabic.
Keep reading
How to Read a Candlestick Chart in 30 Seconds
Candlestick charts look intimidating at first — but once you know what each part means, you can absorb a market's story at a glance. Here's how to do it in 30 seconds flat.
Technical AnalysisDoji Candles: Spotting Market Indecision
Learn how to read doji candles, understand what market indecision really looks like on a chart, and discover how traders use these signals as part of a broader technical analysis strategy.
Technical AnalysisThe Hammer and Shooting Star Reversal Candles
Learn how the hammer and shooting star candlestick patterns signal potential trend reversals, how to identify them correctly, and how to use them responsibly as part of a broader trading strategy.