Among the most recognisable formations in technical analysis, double top and double bottom patterns appear across every market and every timeframe. Whether you trade stocks, forex, or crypto, understanding these structures can sharpen your ability to spot potential trend reversals — before they fully unfold. That said, no pattern guarantees a outcome, and disciplined risk management must always accompany any setup you act on.
What Are Double Top and Double Bottom Patterns?
Both patterns are reversal signals — they suggest that the prevailing trend may be losing momentum and could be about to change direction.
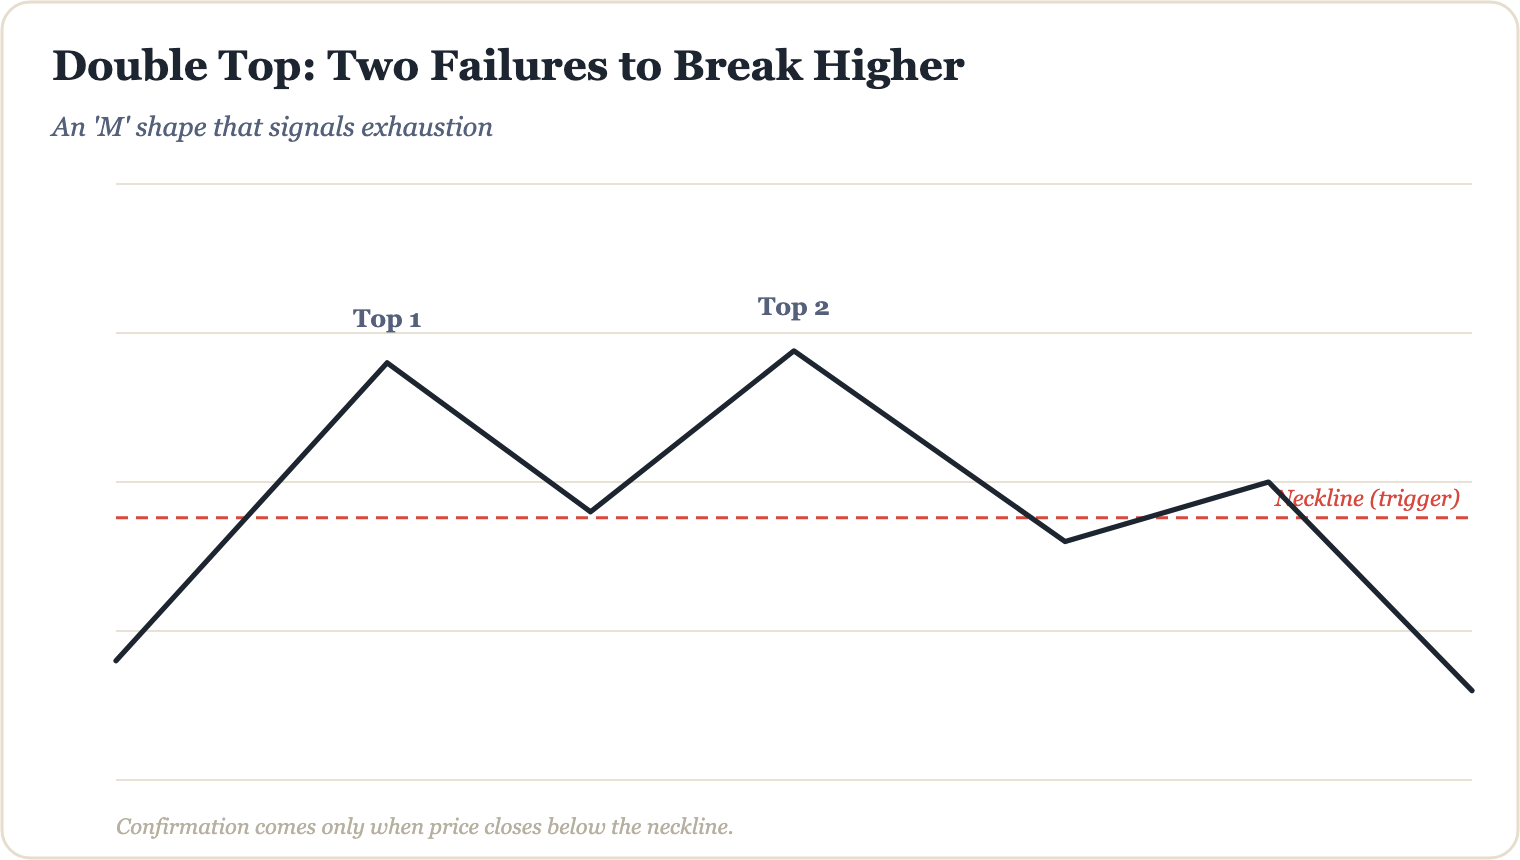
- Double Top: Forms after a sustained uptrend. Price rallies to a high, pulls back, rallies again to roughly the same high, then fails to break through. The shape resembles the letter M.
- Double Bottom: Forms after a sustained downtrend. Price drops to a low, bounces, drops again to roughly the same low, then holds. The shape resembles the letter W.
The key level in both patterns is called the neckline — the swing low between the two tops (in a double top) or the swing high between the two bottoms (in a double bottom). A confirmed break of this neckline is what most traders use as their signal to act.
Reading the Patterns With Real Examples
Double Top Example
Imagine a stock climbing from $50 to $85. It pulls back to $72, then rallies again to $84 — close to the prior high, but not a new one. Volume on the second peak is noticeably lower than the first. Price then falls back through the $72 neckline with conviction. This combination — two similar highs, declining volume, and a neckline break — is a textbook double top. The measured move target is calculated by subtracting the height of the pattern (roughly $13 in this case) from the neckline: a projected move toward $59.
Double Bottom Example
Now picture EUR/USD falling from 1.1200 to 1.0850. It bounces to 1.0980, then slides back to 1.0860 — nearly the same level as the first low — before rebounding strongly. When price closes above the 1.0980 neckline, the double bottom is confirmed. Traders who wait for that neckline break — rather than jumping in at the second low — reduce their exposure to false signals, which are common in this pattern.
"The neckline break is your handshake with the pattern. Without it, you're just guessing at a turning point."
Common Mistakes and Risk Considerations
Even well-formed double tops and bottoms fail regularly. Here are pitfalls to watch for:
- Acting too early: Entering before the neckline breaks means taking on significantly more risk. Wait for a confirmed close beyond the neckline, ideally on above-average volume.
- Ignoring the broader trend: A double bottom forming inside a powerful long-term downtrend carries far less weight than one at a major support zone after an extended decline.
- Skipping a stop-loss: Place your stop just beyond the second peak (for a double top trade) or the second trough (for a double bottom trade). This defines your risk clearly from the start.
- Mistaking noise for a pattern: The two highs or lows should be distinct swings separated by a meaningful pullback — not just minor price wiggles on a 1-minute chart.
Risk management is non-negotiable. Even the highest-probability setups can and do fail, so never risk more than you are fully prepared to lose on any single trade.
Combining the Pattern With Other Tools
Double tops and bottoms work best when confluence lines up. Consider strengthening your analysis by checking:
- Whether the pattern forms near a known support or resistance zone
- Whether momentum indicators like RSI show divergence at the second peak or trough
- Whether the overall market environment supports a reversal, or whether the trend is simply too strong to fade
The more confluent factors pointing in the same direction, the more weight a pattern deserves — though confirmation never equals certainty.
Double top and double bottom patterns are a solid foundation, but they're just one piece of a complete trading framework. If you want to see how these setups fit alongside entry timing, position sizing, and trade management strategies, the full system is laid out in The Millionaire Trader's AI Playbook — a practical, step-by-step guide built for modern traders at every level.
Go from this article to a complete education.
The Millionaire Trader's AI Playbook — 200+ pages, English & Arabic.
Keep reading
How to Read a Candlestick Chart in 30 Seconds
Candlestick charts look intimidating at first — but once you know what each part means, you can absorb a market's story at a glance. Here's how to do it in 30 seconds flat.
Technical AnalysisThe Anatomy of a Candlestick Wick and What It Reveals
Candlestick wicks are more than just thin lines on a chart — they tell the story of rejected price levels, shifting momentum, and hidden market sentiment. Learn how to read them like a pro.
Technical AnalysisDoji Candles: Spotting Market Indecision
Learn how to read doji candles, understand what market indecision really looks like on a chart, and discover how traders use these signals as part of a broader technical analysis strategy.