Trendlines and Channels: Drawing Them Correctly
June 24, 2026 · 5 min read
Of all the tools in a technical analyst's toolkit, trendlines and channels are among the most misused. Traders often force lines onto a chart to fit a bias, rather than letting the price action speak for itself. When drawn correctly, however, trendlines reveal the underlying rhythm of a market — the repeating pattern of momentum and pullback that drives every asset class, from stocks and forex to crypto and commodities.
What Makes a Valid Trendline?
A trendline is only as reliable as the points used to anchor it. Many beginners connect just two swing points and call it a trend — but that's not enough. Here's the foundational rule:
- Two points define the line. A trendline connecting two swing lows (in an uptrend) or two swing highs (in a downtrend) is a candidate line.
- Three points confirm it. When price respects the same line a third time without breaking it, the trendline graduates from candidate to confirmed.
- Angle matters. A trendline steeper than roughly 45 degrees is usually unsustainable and prone to breaking quickly. Treat steep lines with extra caution.
For example, imagine a stock that made swing lows at $40, $44, and $49 over three months. Connecting those three points produces a well-angled uptrend line. Each bounce from that line offers a cleaner, higher-probability setup than a randomly drawn diagonal. Remember, though — no trendline guarantees a bounce; price breaks are a normal part of trading, and risk management must always be in place.
Drawing Price Channels the Right Way
A channel is simply a trendline paired with a parallel line drawn on the opposite side of price. Together they define a corridor through which the market moves, giving traders both a support reference and a resistance reference at the same time.
Ascending Channels
In an ascending channel, the base trendline connects higher swing lows, while the upper channel line is drawn parallel to it through the most significant swing highs. When price trades near the lower line, it may find buyers; when it approaches the upper line, momentum can fade. A practical example: if EUR/USD prints swing lows at 1.0800 and 1.0860, and swing highs at 1.0950 and 1.1010, a parallel channel captures the full range of the move.
Descending Channels
The logic flips in a downtrend. The primary trendline connects lower swing highs, and the lower parallel line is anchored to the notable swing lows. Traders often look for short entries near the upper line, always with a defined stop above it to respect the possibility of a breakout reversal.
"The market is not obligated to respect any line you draw. A trendline is a hypothesis about structure — price either confirms it or it doesn't. Your job is to manage risk around that hypothesis, not to defend it."
Common Mistakes That Distort Your Analysis
Even experienced traders fall into these traps. Knowing them is the first step to avoiding them:
- Cherry-picking touch points. If you have to skip obvious swing points to make the line "work," the line probably isn't valid.
- Drawing too many lines. A cluttered chart creates decision paralysis. Stick to the one or two most prominent trendlines visible on your chosen timeframe.
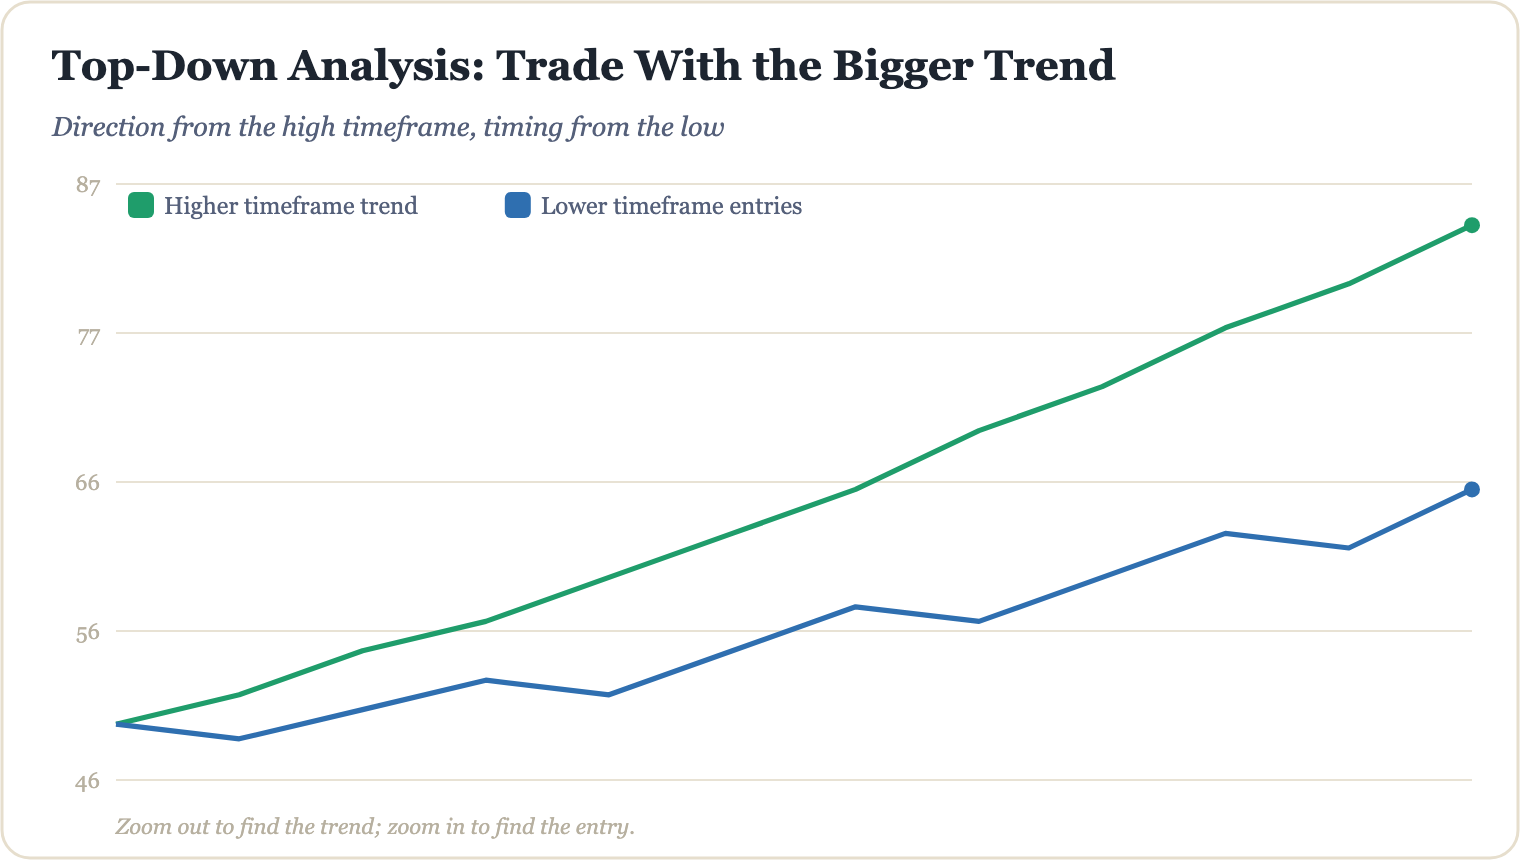
- Ignoring the timeframe hierarchy. A trendline on the daily chart carries far more weight than one drawn on the 5-minute chart. Always confirm direction from a higher timeframe before acting on a lower one.
- Failing to update lines. Markets evolve. Once a trendline is convincingly broken on high volume, delete it or redraw it — clinging to a broken line is one of the fastest ways to misread current market structure.
Putting It All Together
Start each analysis session with a clean chart and a clear question: is this market making higher highs and higher lows, lower highs and lower lows, or is it ranging? From there, draw one trendline per dominant swing direction and wait for a third touch to confirm it. Only then consider placing the parallel channel line. Keep your stop-losses outside the channel boundaries — a close beyond the channel is a signal that structure may be shifting, and no trade is worth ignoring that warning.
Trendlines and channels are deceptively simple on the surface, but mastering their nuance takes deliberate practice. If you want to explore how these tools integrate with momentum indicators, entry triggers, and AI-assisted pattern recognition, the full system is laid out step by step in The Millionaire Trader's AI Playbook — a complete framework designed to help you trade with structure, discipline, and a clear respect for risk.
Go from this article to a complete education.
The Millionaire Trader's AI Playbook — 200+ pages, English & Arabic.
Keep reading
How to Read a Candlestick Chart in 30 Seconds
Candlestick charts look intimidating at first — but once you know what each part means, you can absorb a market's story at a glance. Here's how to do it in 30 seconds flat.
Technical AnalysisThe Anatomy of a Candlestick Wick and What It Reveals
Candlestick wicks are more than just thin lines on a chart — they tell the story of rejected price levels, shifting momentum, and hidden market sentiment. Learn how to read them like a pro.
Technical AnalysisDoji Candles: Spotting Market Indecision
Learn how to read doji candles, understand what market indecision really looks like on a chart, and discover how traders use these signals as part of a broader technical analysis strategy.