The Head and Shoulders Pattern, Step by Step
June 23, 2026 · 5 min read
If you've spent any time studying technical analysis, you've likely heard traders talk about the head and shoulders pattern. It's one of the most widely recognised reversal formations in charting, and for good reason — when it appears clearly on a chart, it can signal that a prevailing uptrend is losing steam. But spotting it accurately takes practice, and acting on it without understanding the nuances carries real risk. Let's break it down, step by step.
What the Head and Shoulders Pattern Actually Looks Like
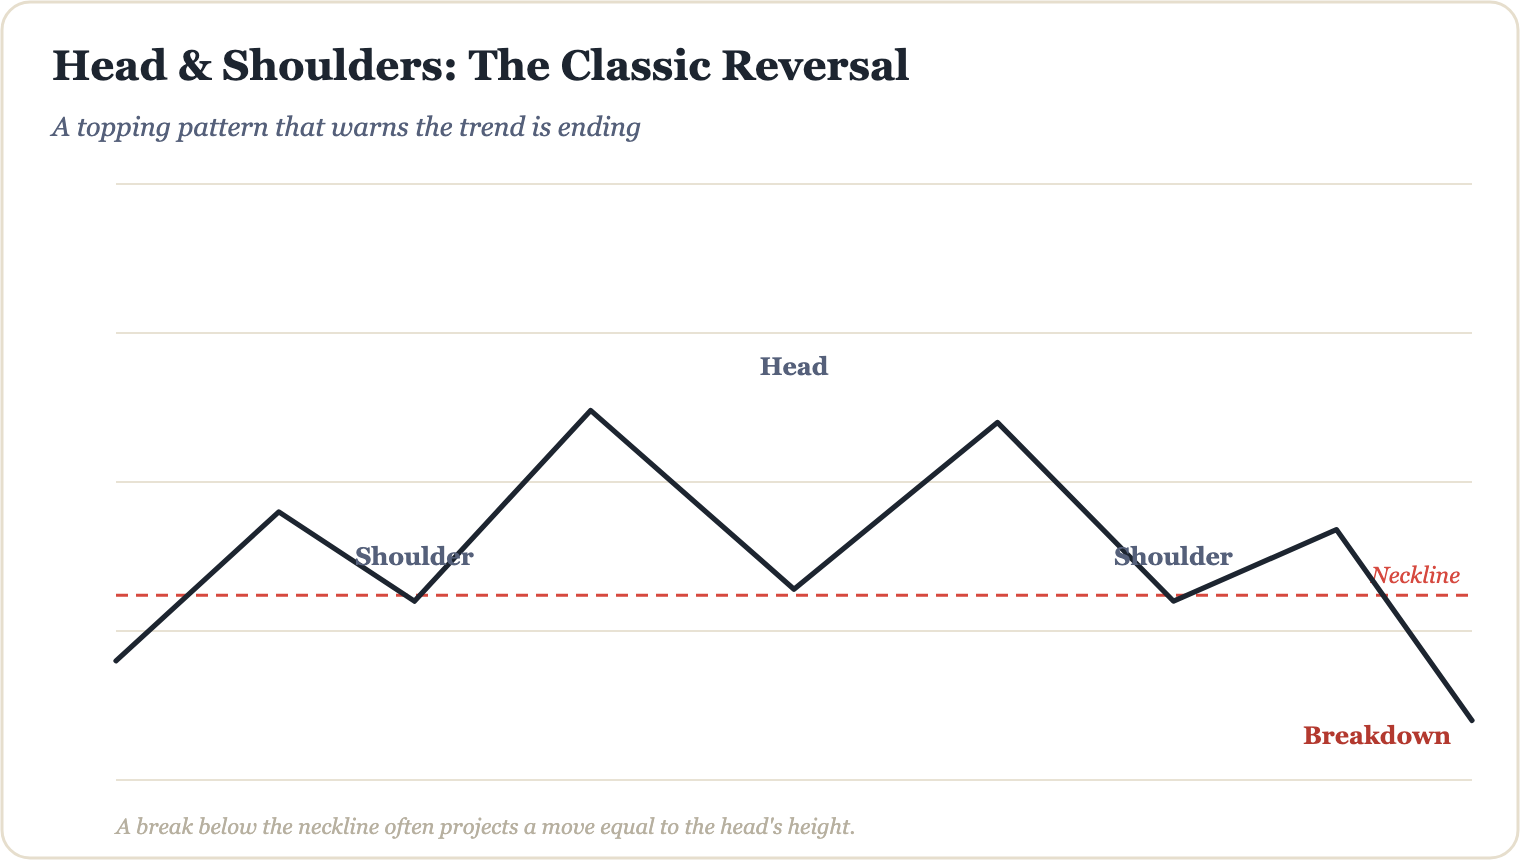
The pattern forms over time and consists of three consecutive peaks:
- Left shoulder: Price rallies to a high, then pulls back.
- Head: Price rallies again to a higher high, then pulls back once more.
- Right shoulder: Price makes a third rally, but only reaches roughly the same height as the left shoulder — failing to match the head.
Connecting the two pullback lows between these peaks gives you the neckline — a critical level to watch. The neckline can be horizontal or slightly sloped. A clean break below it is what technically completes the pattern and draws the attention of traders looking for potential trend reversals.
For example, imagine a stock trading at £40. It rises to £55 (left shoulder), dips to £48, surges to £65 (head), dips back to £49, then rallies only to £56 (right shoulder) before falling again. The neckline sits around £48–£49. A decisive close below that zone completes the formation.
How to Identify the Pattern Step by Step
Recognising the pattern in real time — rather than in hindsight — is the genuine challenge. Here's a structured approach:
- Step 1 — Confirm a prior uptrend: The head and shoulders is a reversal pattern. There must be a clear uptrend before it for the signal to be meaningful.
- Step 2 — Mark the three peaks: Identify each high. The head should be visibly higher than both shoulders. Symmetry matters, but it doesn't need to be perfect.
- Step 3 — Draw the neckline: Connect the two reaction lows. This becomes your key reference line.
- Step 4 — Watch for the break: A confirmed close below the neckline — ideally on elevated volume — strengthens the signal. One candle alone is rarely enough; look for follow-through.
- Step 5 — Measure the projected move: A common technique is to measure the distance from the head's peak to the neckline, then project that distance downward from the breakout point. This gives a rough price target — not a guarantee, but a useful reference for managing expectations.
"A pattern without context is just a shape. Always ask: What was price doing before this formed, and what is the broader market telling you right now?"
Common Mistakes Beginners Make
Trading any pattern without discipline can be costly. Here are pitfalls to avoid:
- Jumping in before the neckline breaks: Many traders anticipate the pattern and enter early, only to watch price recover and invalidate the setup entirely. Patience is essential.
- Ignoring volume: Volume should ideally expand on the breakdown. A low-volume break is a weaker signal and warrants extra caution.
- Forgetting about the failed pattern: Sometimes the neckline breaks, price reverses sharply upward — this is called a failed head and shoulders or a "trap." Always define your risk with a stop-loss before entering any trade.
- Forcing the pattern onto a chart: Not every three-peak formation is a head and shoulders. If you have to squint and bend the rules, it probably isn't one.
The Inverse Head and Shoulders — A Quick Note
The same logic applies in reverse. An inverse head and shoulders forms after a downtrend, with three troughs — the middle one being the deepest. A break above the neckline in this case signals a potential bullish reversal. Traders apply the same step-by-step process: confirm the downtrend, mark the troughs, draw the neckline, and wait for a confirmed break with volume. Again, no pattern offers certainty — risk management remains non-negotiable regardless of how textbook the setup looks.
The head and shoulders pattern is a powerful addition to any trader's visual toolkit, but it works best as part of a broader, structured framework. If you want to go deeper — combining this pattern with volume analysis, momentum indicators, and AI-assisted trade planning — the full system is laid out in The Millionaire Trader's AI Playbook, where chart patterns like this are integrated into a complete, step-by-step trading methodology.
Go from this article to a complete education.
The Millionaire Trader's AI Playbook — 200+ pages, English & Arabic.
Keep reading
How to Read a Candlestick Chart in 30 Seconds
Candlestick charts look intimidating at first — but once you know what each part means, you can absorb a market's story at a glance. Here's how to do it in 30 seconds flat.
Technical AnalysisThe Anatomy of a Candlestick Wick and What It Reveals
Candlestick wicks are more than just thin lines on a chart — they tell the story of rejected price levels, shifting momentum, and hidden market sentiment. Learn how to read them like a pro.
Technical AnalysisDoji Candles: Spotting Market Indecision
Learn how to read doji candles, understand what market indecision really looks like on a chart, and discover how traders use these signals as part of a broader technical analysis strategy.